Select your geography
Americas
Unlocking China's Hidden Bond Treasures: Why Investors Can't Ignore Its US$17 Trillion Onshore Market

Arthur Lau, CFA
Co-Head of Emerging Markets Fixed Income, Head of Asia ex Japan Fixed Income

Emily Lam
Client Portfolio Manager, Fixed Income

Samsara Wang
Asian Sovereign Analyst

Fan Zhang, CFA
Portfolio Manager & Credit Analyst, Fixed Income
China’s onshore local currency bond market, currently at about US$17.5 trillion, is now the second-largest individual bond market in the world after the US.
Attracted by yields and diversification potential, international investors have awakened to the opportunities that Chinese local currency bonds offer. Yet questions remain over how global investors can best gain exposure to this rising asset class.
We believe the market’s dynamics and the evolving operating environment for credit issuers create compelling opportunities for research-driven investors.

For Professional Investors Only
Two things jump out when exploring the potential of China’s onshore local currency bond market – its size and rapid growth. The market has blossomed five times larger from a decade ago to approximately US$17.5 trillion.2 Today, the world’s second-largest individual bond market resides in the world’s second-largest economy.3
In all likelihood, the market will only continue to expand as China gains greater economic and financial power. With the rest of the world struggling from Covid-19’s severe economic setbacks, China was the only major economy to get larger in 2020, cementing its role as the world’s growth engine.4 China is forecast to reach high-income status in the next five years, and per capita income is set to double by 2035. Over the long term, secular trends such as consumption, urbanization, and technological advancements should continue to power the economic expansion and demand for capital.
Attracted by yields and diversification potential, international investors have awakened to the opportunities Chinese local currency bonds offer. In 2020, total trading volume in the onshore market reached CNY241 trillion (US$37 trillion) -- a record high.5 Yet questions remain over how global investors can best gain exposure to this rising asset class. Global bond benchmarks have yet to fully represent this market’s investable segment despite the recent inclusion of government bonds. And while the market is more open than ever to foreign investors, navigating the vast issuer universe may pose some peculiar hurdles.
China’s onshore market is unlike any other major bond market partly due to its unique structure. Leveraging our deep fixed income research capability in Asia, we’re well-placed to explain the market’s idiosyncratic characteristics and how these features can help define the opportunity set and suitable investment approach. We aim to demystify the China onshore bond market through a layer-by-layer deconstruction of the market, its issuers, and their changing operating environment.
China’s gates swing open
Like Chinese onshore equities, the bond market had been largely closed to foreign investors until the Qualified Foreign Institutional Investor program launched in 2002, allowing direct access for select investors. Despite the limited domestic access, Chinese corporates have issued US dollar bonds overseas, creating a vibrant offshore market.
But as China pushed to internationalize the yuan, the launch of “dim sum” bonds or yuan-denominated bonds issued in Hong Kong in 2010 boosted foreign access to local currency bonds. In 2017, the landmark Bond Connect with Hong Kong allowed institutional and retail investors to trade in listed bonds in China through the Hong Kong Exchange. Among the reasons the Bond Connect is considered the most investor-friendly among these direct investment channels are its ease and breadth of access (all cash bonds), less onerous investor eligibility criteria, the availability of hedging instruments in Hong Kong to hedge currency exposures, and easier repatriation of funds. It has attracted investors from approximately 34 developed and emerging markets, with foreign bond holdings using Bond Connect nearly quadrupling from CNY882 billion at launch in July 2017 to CNY3.25 trillion by the end of 2020. Yet this is merely 3% of total onshore bond market capitalization. 6 Compared to other major bond markets, the low foreign ownership in Chinese onshore bonds, index inclusion and continued market opening mean we expect the demand for onshore bonds to be structural rather than cyclical.
Foreign Holdings Using Bond Connect Have Steadily Grown
Total Foreign Holdings
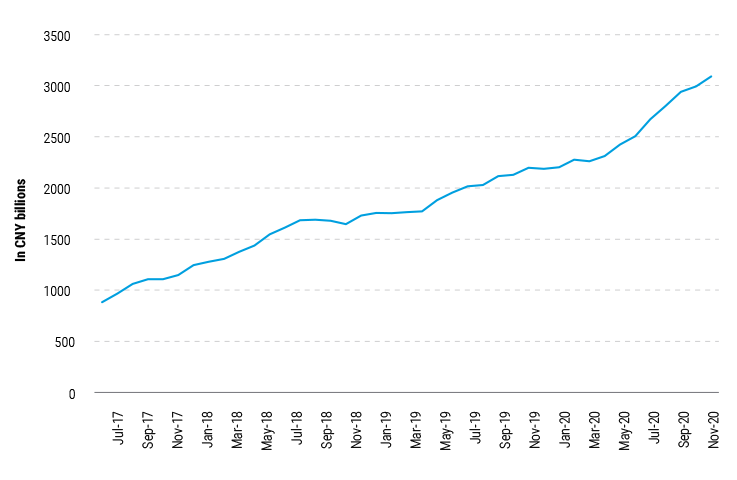
Source: WIND as of 31 December 2020. For illustrative purposes only. We are not soliciting or recommending any action based on this material.
Foreign inflows into Chinese government bonds (CGBs) have picked up sharply after inclusion to the Bloomberg Barclays Global Aggregate Bond Index and J.P. Morgan Government Bond Index-Emerging Markets (GBI-EM) Index in recent years. FTSE Russell is including CGBs to its World Government Bond Index (WGBI) with a weighting of around 5%. Assuming $2.5-$3 trillion of capital tracking the index, we estimate passive flows of $125-$150 billion.
Inflows Into CGBs Have Increased Since Their Inclusion to Major Indexes
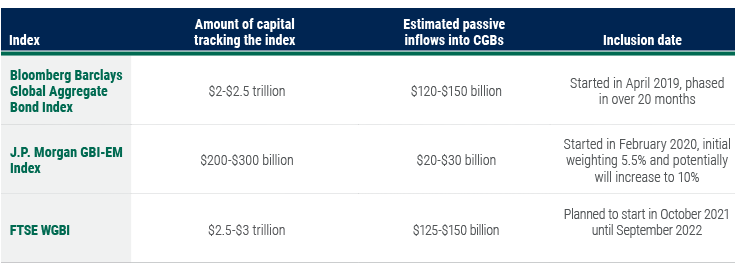
Source: Bloomberg, J.P. Morgan, FTSE Russell, PineBridge Investments as of 16 March 2021. For illustrative purposes only. We are not soliciting or recommending any action based on this material.
Onshore local currency bonds: A league of their own
China’s onshore local currency bond market primarily comprises government and government-related issues. But it is far from homogenous. We view the market as having two parts: the rates market, which accounts for the majority of total bonds outstanding and comprises government bonds; and the credit market, which includes corporate issuers like state-owned enterprises (SOEs) and privately owned enterprises (POEs).
Government and Government-Related Issuers Dominate the Onshore Market
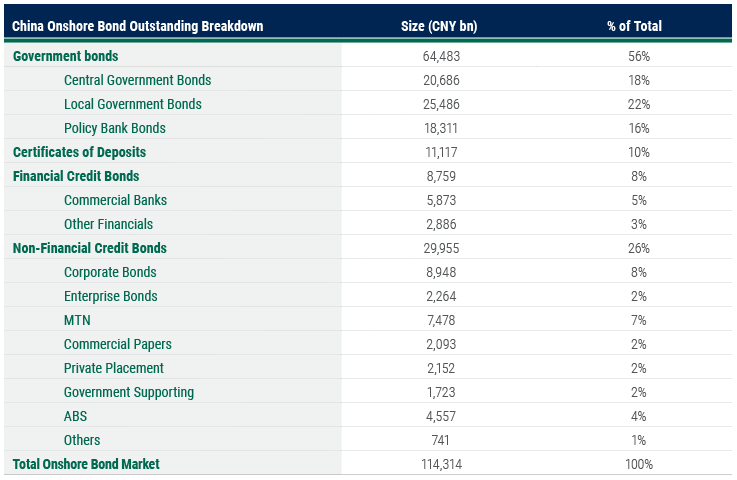
Source: WIND as of 31 December 2020. For illustrative purposes only. We are not soliciting or recommending any action based on this material.
1. The rates market
Rates market bonds include central government bonds (CGBs), local government bonds, People’s Bank of China (PBOC) bills, and policy bank bonds.7 They are more heavily traded than credit bonds, with policy bank bonds the most liquid among them, followed by certificates of deposits, and CGBs.
Rate Bonds Are Generally More Liquid Than Credit Bonds
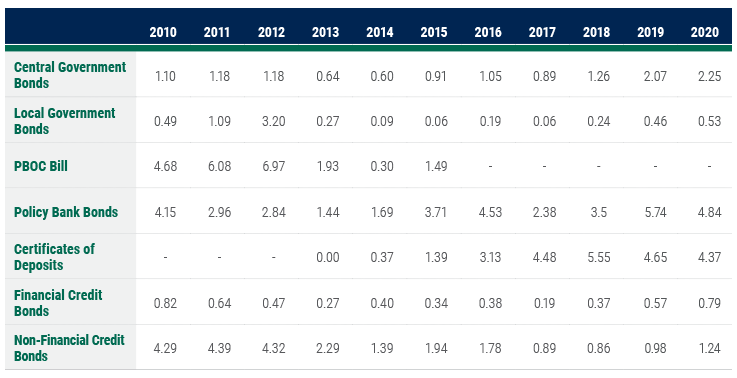
Source: WIND as of 31 December 2020, Calculated as the ratio of trading volume over amount of bonds outstanding. For illustrative purposes only. We are not soliciting or recommending any action based on this material.
The rates market stands out globally for two compelling potential benefits that are hard to come by in today’s world of ultra-low rates and increasing global asset class correlations: higher yields and diversification.
Attractive yield
Given its A+ sovereign rating, positive currency outlook, and yields of over 3%, demand for CGBs has increased especially after being included into major bond indexes.8 As of end of February 2021, the 10-year CGBs offered 80 basis points (bps) over 10-year US Treasuries, if hedged back to the US dollar. The yield pickup against other major currencies such as the Japanese yen (JPY) and the euro (EUR) are 98bps and 114bps, respectively, on a fully hedged basis.9 (Please refer to section on Currency Outlook for our view on the yuan.)
We believe CGBs have offered decent yield pickup against major developed market bonds, with the exception of 2018 when China paused its deleveraging campaign and eased tight monetary and liquidity conditions. This resulted in a sharp drop in CGB yields. Despite better economic outlook post COVID-19, we do not expect the PBOC to cut rates in the medium term. As such, we believe CGBs will continue to offer attractive yields vis-à-vis other major sovereign bonds in coming years given the interest rate differentials. We advocate an unhedged strategy to capture the optimal return when investing in CGBs in particular, or China onshore bonds in general.
CGBs Offer Higher Yields Than Major Developed Market Bonds After Hedging Costs
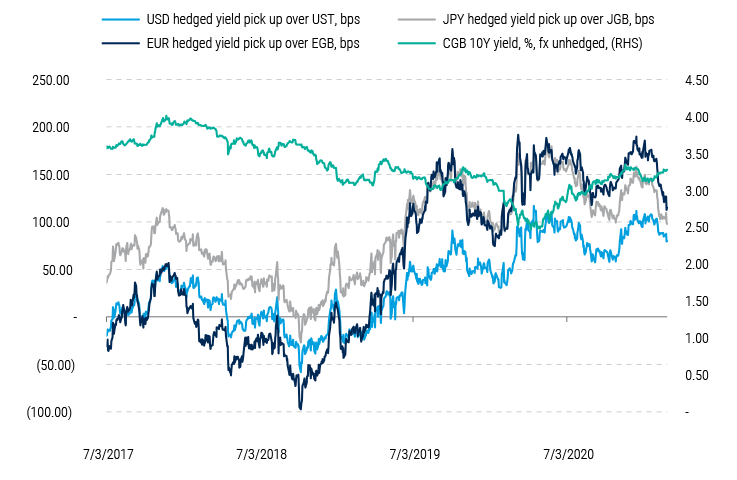
Source: Bloomberg, PineBridge Investments as of 26 February 2021. For illustrative purposes only. We are not soliciting or recommending any action based on this material.
Low correlations and volatility
Low correlations with developed market bonds also offer CGBs an advantage within the A+ rating segment. On balance, the correlation of CGBs with other major sovereign bonds has been low, making CGBs an attractive diversifier in a global portfolio. In addition, we believe the potential steepening of the US Treasury curve will have limited impact on CGBs.
Moreover, CGB volatility is one of the lowest among major sovereign bonds. As shown in the table below, since the Bond Connect began in 2017, CGBs have been less volatile.
CGBs Have Historically Low Correlations and Volatility Versus Developed Market Peers
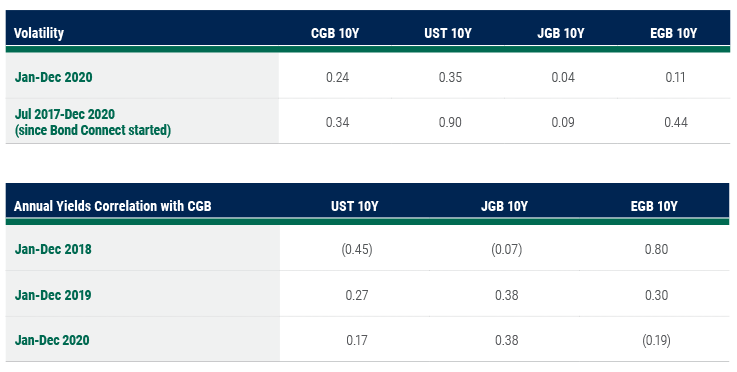
Source: Bloomberg, PineBridge Investments as of 31 December 2020. For illustrative purposes only. We are not soliciting or recommending any action based on this material. UST = US Treasury, JGB = Japanese Government Bonds, and EGB= European Government Bonds.
2. The credit market
Credit bonds expanded rapidly over the last decade alongside the development of China’s capital markets. By the end of 2020, this category’s share hit 34% of the overall market from 22% in 2010, with CNY39 trillion (US$6 trillion) in outstanding credit bonds.10 The market’s size easily eclipses the Chinese credit opportunities represented in the J.P. Morgan Asia Credit Index (JACI) at $608 billion.11
The Credit Bond Market Continues to Grow
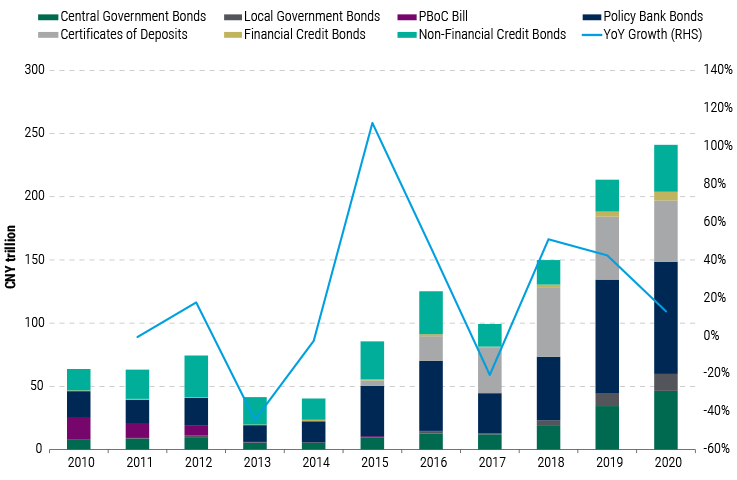
Source: WIND as of 31 December 2020. For illustrative purposes only. We are not soliciting or recommending any action based on this material.
China’s credit market has idiosyncratic characteristics not found in other major fixed income markets. First, more than 60% of the bonds outstanding are domestically rated AAA.12 (That said, a domestic rating is not necessarily equivalent to the same letter rating assigned by international credit rating agencies. We will discuss this further in the next section.)
Conversely, JACI index has 6% in AAA/AA by international rating agencies, 30% in A, 39% in BBB, and 25% in high yield from BB+ to C.13 The limited diversity in the ratings spectrum in China’s onshore bond market is partly because domestic institutions are required to invest only in bonds rated AA or higher.
Credit Bonds Receive High Ratings From Domestic Rating Agencies
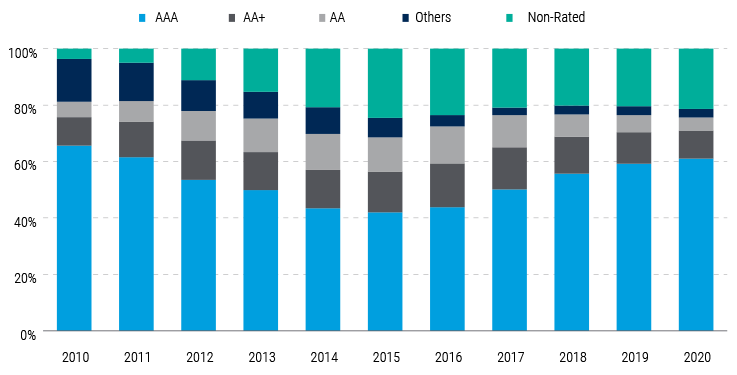
Source: WIND as of 31 December 2020. Ratings refer to bond rating as of the corresponding years. For illustrative purposes only. We are not soliciting or recommending any action based on this material.
Second, a substantial portion of bonds are issued by government-related entities, largely local government financial vehicles (LGFVs). These entities generally finance, invest in, and operate public infrastructure projects on behalf of local governments. Issuance from LGFVs picked up in recent years and we expect this trend to continue. It is important to note that LGFV covers many sectors and the bonds’ purposes vary significantly from infrastructure-related investments to refinancing SOEs. Local government-related entities have also been leaders in issuing green bonds.
SOEs and LGFVs Dominate Non-Financial Credit Issuers
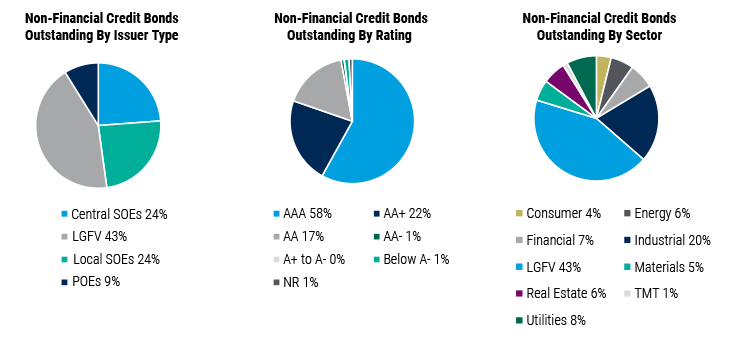
Source: WIND, PineBridge Investments as of 31 December 2020. For illustrative purposes only. We are not soliciting or recommending any action based on this material.
Despite being a highly rated credit market in a domestic context, underlying credit conditions show substantial diversification, which warrants an intensive and vigorous bottom-up credit process to identify gems and avoid undesirable credit exposures.
Credit differentiation: looking beyond the label
Domestic credit rating agencies assess the credit quality of onshore credit bond issuers. However, foreign investors will find that these local ratings cannot be directly mapped to the corresponding letter rating assigned by international agencies. For instance, a domestic AAA-rating is generally regarded as investment grade, but this category lacks the sub-rating differentiation found in international ratings (that is, the progression of 10 notches from BBB- to AAA).
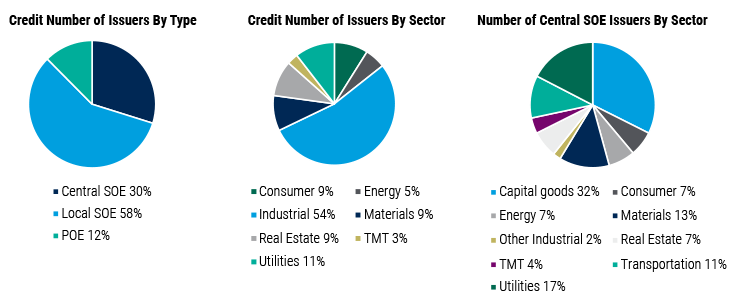
Only 300 issuers in the onshore credit market hold international ratings (from having issued bonds offshore).14 If we look at the highest quality names, just over 1,000 (21%) are regarded as investment grade.15 This makes assessing credit quality a tall order for investors.
Only a Fifth of High Quality Issuers Are Regarded as Investment Grade
Number of Credit Issuers By Domestic Rating
Source: WIND, PineBridge Investments as of 31 December 2020. For illustrative purposes only. We are not soliciting or recommending any action based on this material.
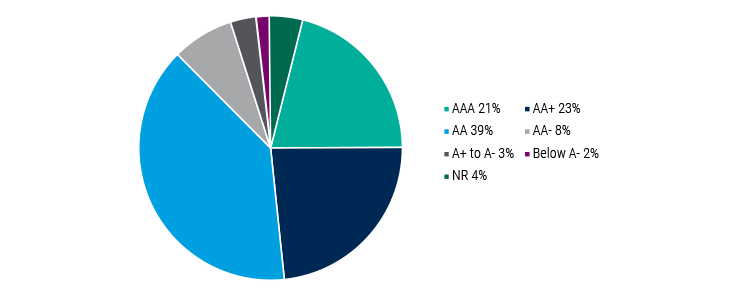
Moreover, the majority of these domestically AAA-rated issuers (approximately 800) are non-financial, non-LGFVs corporate credits, of which about a third are central SOEs operating across a variety of sectors such as public utilities, transportation, and national resources. Only 20%-30% of these issuers are rated offshore.16 Investors tend to favor bonds issued by SOEs over POEs due to the former’s implicit government support as well as their higher ratings. However, the relationship between government-linked issuers and their sponsors has been evolving, with the implicit guarantee now less iron clad than previously assumed as recent SOE defaults demonstrate.
SOEs Dominate the Domestic AAA-Rated Non-Financial, Non-LGFV Segment
Source: WIND, PineBridge Investments as of 31 December 2020. For illustrative purposes only. We are not soliciting or recommending any action based on this material.
Indeed, not all SOEs are created equal, with centrally backed SOEs likely to have stronger government support in the event of financial distress than local SOEs. This changing dynamic could yield opportunities for investors who are focused on credit differentiation among the different types of government-linked issuers. But with over 5,000 issuers in the credit market,17 investors may also find it worthwhile to engage with asset managers possessing deep research capabilities to thoroughly analyze these issuers’ credit quality and ownership to determine most compelling opportunity set.
Opportunities in the credit market
We believe China’s credit market offers a wealth of opportunities for active credit selectors. For instance, among local government-related issuers investors should price in more premium for credits with weak standalone profiles or poor corporate governance.
Credit differentiation has deepened over time, with spreads of local AA- and A+ increasing by 74 bps and 100 bps, respectively, over the last three years (2018-2020), while AAA and AA+ tightened by 73 bps and 46 bps, respectively, during the same period.18 We view this trend as a healthy development for differentiating credit quality and encouraging more efficient credit risk pricing.
Credit Differentiation Has Deepened Over the Last Three Years
5Y Corp Bond Yield by Rating
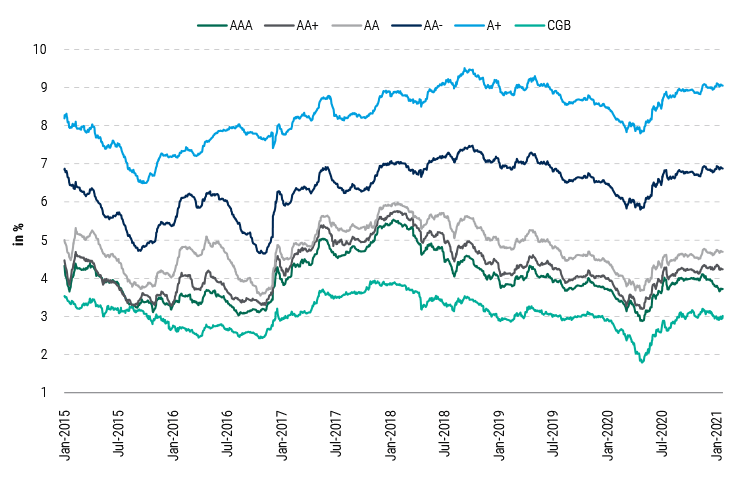
5Y Corp Bond Yield Spread Over CGB by Rating
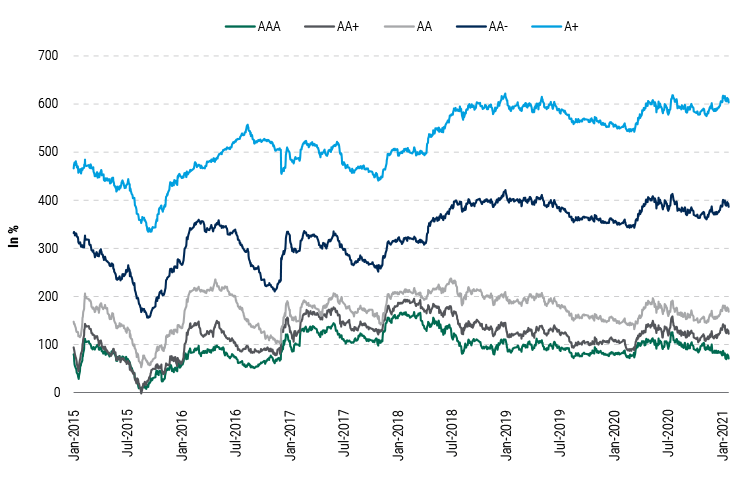
Source: WIND as of 26 January 2021. For illustrative purposes only. We are not soliciting or recommending any action based on this material.
We see more value in shorter tenor bonds, given the largely flat spread of AAA-rated corporates over CGBs (from 70 bps at one year to 100 bps at 10 years). That means, a high quality three-year corporate credit offers the same yield as 15-year CGB.
Short Tenor Bonds Are Attractive
Bond Yield by Tenor
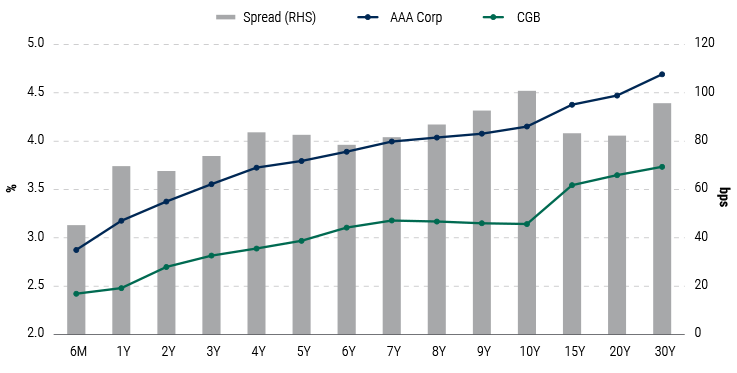
Source: WIND as of 31 December 2020. For illustrative purposes only. We are not soliciting or recommending any action based on this material.
Emerging trends and potential risks
Default trends
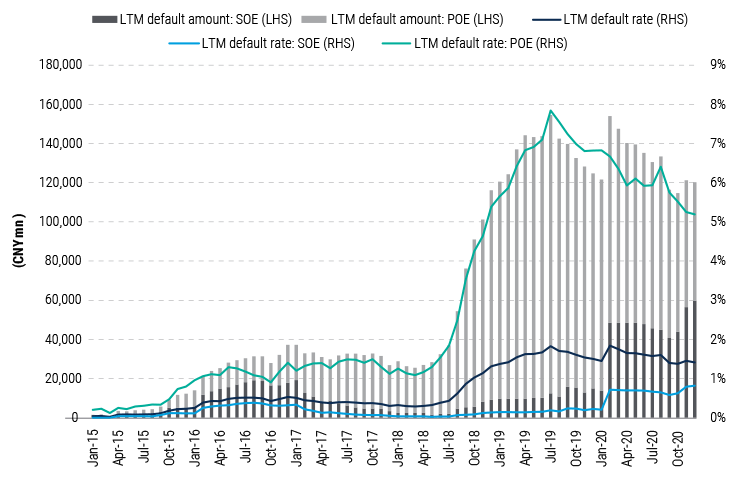
SOE defaults may have been rare in previous decades, but several have occurred in recent years. In 2015-2016, a few SOEs in the metals and mining sector defaulted following supply-side reforms. Credit-tightening measures in the shadow banking sector ushered in a slew of missed payments, largely by POEs in 2018-2019. In 2020, six SOEs defaulted.19 We view the latest SOE defaults as idiosyncratic cases that should not cause systemic problems for the onshore market. Red flags appeared for these companies that should have been evident through fundamental research. Regulators have also stepped in to investigate one company’s debt underwriters for potential violations, and China’s vice premier warned of “zero tolerance” toward financial misconduct in the bond market, signaling that the central government views market stability as key.
The onshore market default rate increased from 0.3% in 2017 to 1.5% in 2019 and 1.4% in 2020.20 We expect this trend to pick up moderately in the next 12 to 18 months, partly due to pandemic-related financial stress. However, we emphasize that we expect defaults to remain at a reasonable level compared to other major credit markets. In comparison, 2020 default rates for Asian high yield, EM high yield, and US high yield were 3.5%, 3.5% and 6.8%, respectively. The default risk of SOEs is still lower on average than for POEs (below 1% for SOEs versus more than 5% for POEs in the last two years).21 We view the default trend as reflecting the market’s growing maturity, exhibiting both diversity and relative value within certain segments.
We believe credit selection among SOEs is important given the government’s evolving capability and willingness to support them. With Covid-19 weakening their fiscal positions, local governments in certain regions have less capacity to backstop SOEs. We expect more selective support toward local SOEs. That is, relative to commercial sectors, governments are more likely to prevent SOE defaults in critical sectors, such as social services, or in strategically important industries, such as major oil companies, state-owned banks, and infrastructure and power companies.
SOEs Have a Better Default Track Record Than POEs
Source: WIND, BofA as of December 2020. For illustrative purposes only. We are not soliciting or recommending any action based on this material.
Investor base
Despite growing foreign inflows, domestic investors dominate China’s credit market. For non-financial credit bonds in the interbank market, commercial banks are the largest buyers at 47% of the market. They are followed by funds, which are collective investment vehicles that hold investments and repackage them as financial products for retail and institutional investors, such as banks’ wealth management products, mutual funds, and insurance products. Funds also account for more than half of investors in commercial bank credit bonds.22 With an investor base integrated into the domestic financial system that is largely controlled by the central government, systemic risk is relatively low.
We expect the waiver of the 10% withholding tax and 6% value-added tax on interest income for foreign institutions investing in the domestic bond market to encourage more foreign fund flows, 23 and this waiver may be extended for a longer period.
Currency outlook
Over the long term, the internationalization of the yuan will further open the domestic financial market and boost the yuan’s reserve currency position, which, in turn, will put the currency in an appreciation trend.
Most investors want long yuan exposure by entering into a CGB position. Over a 12-month horizon, we hold a constructive view on the yuan on the back of a strong economic recovery, supportive current account, decent bond index inflows, and the adjustment in the China Foreign Exchange Trade System (CFETS) basket (lower US dollar weighting), which creates room for the CFETS Renminbi (RMB) Index to strengthen further. Our 2021 year-end target exchange rate for the yuan is 6.35 to the US dollar, an appreciation of approximately 3% from yearend 2020.24
Opportunity in complexity
Given the sheer size of China’s onshore bond market and its growth prospects, investors may find that a one-size-fits-all investment approach may constrain their ability to take advantage of the breadth of opportunities at hand.
For rate investors and traditional high quality, sovereign-only investors who focus mainly on reserve, government bonds and investment grade markets, the market offers highly rated, low correlation, and higher yielding (even on hedged basis) opportunities. Diversification and better yield could result in better risk-adjusted returns for their portfolios.
Credit-focused investors will find substantial returns and risk diversification in the onshore market with higher credit spreads and access to fast-growing companies/sectors that have not issued offshore US dollar bonds. They can invest exclusively in onshore bonds or in a portfolio of yuan and US dollar-denominated bonds. However, the need for credit differentiation and due diligence, among others, may require a more hands-on approach. Investors may find that tapping into the resources of asset managers that have strong on-the-ground credit research teams or are deeply rooted in the Chinese and Asian credit markets can help them navigate various sectors, credit cycles, and evolving government policies.
Clearly, the opening of China’s onshore bond market marks a potentially once-in-a-lifetime opportunity to access a wide range of yuan bonds and be rewarded with attractive risk-adjusted returns for rate- or credit-focused or even index investors. Nevertheless, we emphasize that the keys to success in this market are research, proximity, and flexibility. We believe investors will be better rewarded by working with Asian fixed income specialists with strong research capabilities and who are based in the same time zone. Those that can swiftly identify and address trends and market-moving events across the rates and credit segments are best positioned to capture opportunities wherever they arise.
Footnotes
1 WIND as of 31 December 2020
2 WIND, Bloomberg as of 31 December 2020
3 World Bank data as of 2019, GDP in current prices, accessed 3 March 2021
4 IMF, PineBridge as of February 2021
5 WIND, Bloomberg as of 31 December 2020
6 Bond Connect, Wind as of 31 December 2020
7 China’s main policy banks include the China Development Bank, the Agricultural Development Bank of China, and the Export-Import Bank of China.
8 Bloomberg, PineBridge Investments as of 26 February 2021
9 Bloomberg, PineBridge Investments as of 26 February 2021
10 WIND as of 31 December 2020
11 J.P. Morgan as of 31 December 2020
12 WIND as of 31 December 2020
13 J.P. Morgan as of 31 December 2020
14 WIND, PineBridge Investments as of 31 December 2020
15 WIND, PineBridge Investments as of 31 December 2020
16 WIND, PineBridge Investments as of 31 December 2020
17 WIND, PineBridge Investments as of 31 December 2020
18 WIND as of 26 January 2021
19 WIND, BofA as of December 2020
20 WIND, BofA as of December 2020
21 WIND, BofA as of December 2020
22 WIND as of December 2020
23 See “China Issues Formal Tax Regulation for Three-year Tax Exemption on Bond Interest for Foreign Investors,” PwC, November 2018. https://www.pwccn.com/en/financial-services/fstax-news-nov2018-3.pdf
24 PineBridge Investments as of 26 February 2021
Disclosure
Investing involves risk, including possible loss of principal. The information presented herein is for illustrative purposes only and should not be considered reflective of any particular security, strategy, or investment product. It represents a general assessment of the markets at a specific time and is not a guarantee of future performance results or market movement. This material does not constitute investment, financial, legal, tax, or other advice; investment research or a product of any research department; an offer to sell, or the solicitation of an offer to purchase any security or interest in a fund; or a recommendation for any investment product or strategy. PineBridge Investments is not soliciting or recommending any action based on information in this document. Any opinions, projections, or forward-looking statements expressed herein are solely those of the author, may differ from the views or opinions expressed by other areas of PineBridge Investments, and are only for general informational purposes as of the date indicated. Views may be based on third-party data that has not been independently verified. PineBridge Investments does not approve of or endorse any republication of this material. You are solely responsible for deciding whether any investment product or strategy is appropriate for you based upon your investment goals, financial situation and tolerance for risk.