Select your geography
Americas
As the PMI Cycle Turns, Credit Assets Are Looking Good. Here’s Why.

Hani Redha, CAIA
Portfolio Manager, Global Multi-Asset

John Yovanovic, CFA
Portfolio Manager, Co-Head of Leveraged Finance

The recent pandemic-fueled recession and recovery have concentrated years’ worth of cyclical market moves into just a few months. Yet while Covid-era disruptions have made many believe the old rules may no longer apply, asset performance has actually behaved largely according to the classic playbook, with equities surging as the economy rebounded.
When looking ahead to asset class performance and rotations to come, one key measure – global purchasing managers’ indices (PMIs) – may offer a glimpse into what to expect. Specifically, our analysis of Institute for Supply Management (ISM) new orders data has revealed consistent patterns in asset performance that have held up over cycles historically.
What are global PMIs signaling for investments today? As PMIs approach peak expansion and look poised to slow, we expect a shift in the top performers from equities to high yield bonds and other credit assets – and believe a period of mini-cycles of PMI expansion will contribute to a “Goldilocks” environment for credit in the near term.
Investment clues from the four PMI phases
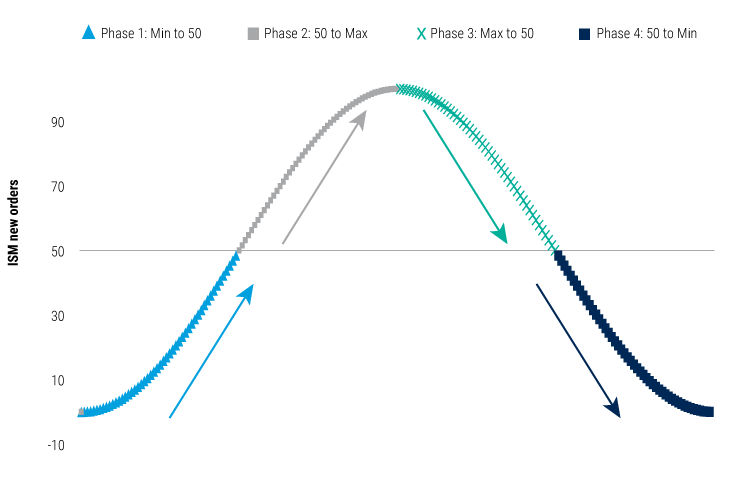
When looking at PMI metrics, most investors focus solely on the “50 line” – where numbers over 50 indicate expansion and under 50 signal contraction. We think a more nuanced view can be revealing, and see four distinct phases in the PMI cycle that can signal where asset performance may be headed:
Phase 1: Minimum rising to 50 (contraction, but coming off the trough)
Phase 2: 50 rising to maximum (strong and accelerating expansion)
Phase 3: Maximum down to 50 (continued expansion, but slowing from the peak)
Phase 4: 50 down to minimum (contraction takes hold and strengthens)
Stylized ISM Cycle

Source: PineBridge Investments. For illustrative purposes only. We are not soliciting or recommending any actions based on this material.
We view the transition from the PMI peak to 50, and vice versa – phases 2 and 3 – as particularly useful indicators of past asset class performance and predictors of future rotations because the market is increasingly spending most of its time in these two phases.
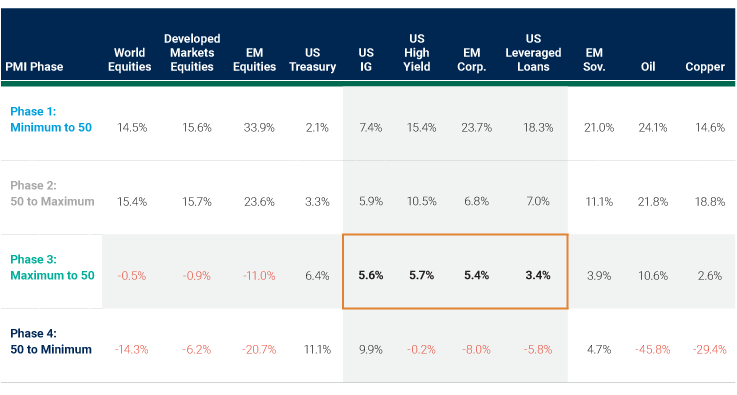
Currently, we appear to be entering phase 3, with both manufacturing and service PMIs continuing to expand but poised to slow off their peak. This is the same point in the cycle in which high yield bonds and other credit assets have tended to outperform other asset classes historically, as the table below shows.
Credit Assets Tend to Outperform When PMI Expansion Comes Off Its Peak
(Historical asset class performance during the four phases of ISM new orders)

As of 20 May 2021. Proxies for each asset class are as follows: World Equities, MSCI World Index; Developed Markets Equities, MSCI ACWI Index; EM Equities, MSCI Emerging Markets Index; US Treasuries, Bloomberg Barclays US Treasury Total Return Unhedged USD; US Investment Grade, Bloomberg Barclays US Corporate High Yield Total Return Index Value Unhedged USD; US High Yield, Bloomberg Barclays US Corporate High Yield Total Return Index Value Unhedged USD; US Leveraged Loans, S&P/LSTA Leveraged Loan Total Return Index; EM Corporate, J.P. Morgan Corporate EMBI Broad Diversified Composite Index Level; EM Sovereign, J.P. Morgan EMBI Global Diversified Composite; Oil, Generic First Oil Future; Copper, Generic First Copper Future. Performance shown since inception for each index. For illustrative purposes only. We are not soliciting or recommending any actions based on this material.
Looking at what’s happening now, equity returns are generally positive but lower than in earlier phases, in line with historical PMI trends. What may throw off many investors is that the best returns often happen at the worst time – for example, after the Covid-related disruptions last year, the strongest returns came right after the bottom. Once PMIs cross above 50 (phase 2), equity returns may slow or hold steady but are still attractive. But as PMIs enter phase 3 and begin to decelerate, the whole pattern changes: Equities and other assets that are most growth-sensitive start to flatline, while credit assets begin to outperform.
PMIs and credit: exploring a fundamental hunch
Why has this rotation from equities to credit happened historically, and why do we expect the trend to continue this time around? We find the tendency fairly intuitive: What initially prompted us to look at the relationship between PMI phases and asset performance was a fundamental hunch, based on the idea that equities are most sensitive to growth, while high yield credit provides a less sensitive ongoing exposure to growth through carry (assuming the economy doesn’t go into recession).
Essentially, the “Goldilocks period” for credit assets is an economy that is “not too hot, not too cold”: It needs to be hot enough for continued expansion, but not so hot that inflation and interest rates become a big concern; conversely, because credit is dependent on default expectations, it can’t be cold enough to cause default rates to spike. So the sweet spot for most credit – whether high yield, investment grade, emerging markets debt, or leveraged loans – is a “just right” environment like we’re anticipating, with GDP growth in a more moderate band that encourages credit spreads to slowly tighten over the period.
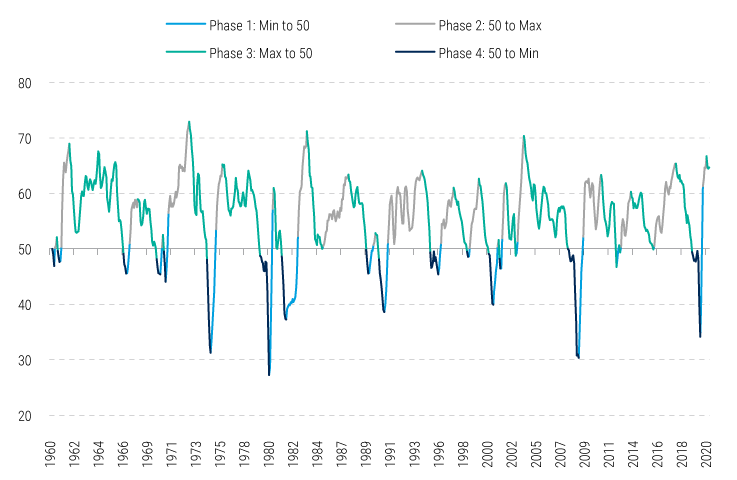
Moreover, as opposed to the boom/bust cycles we often saw in the past, in which PMIs would fall significantly below 50 much more frequently, today’s more services-oriented economy (especially in the US) is less dramatically cyclical. As the chart below shows, during the 2010-2020 period, PMIs rarely fell below 50, and there was no real recession for 10 years – just periods of slowing and reacceleration. That is what we expect to see now: not a true midcycle transition toward a recession, but rather a period of expansionary “mini-cycles,” when metrics may bump against 50 on the lower end before picking back up, avoiding a true contraction.
ISM New Orders Have Experienced ‘Mini Cycles’ of Expansion Over the Past Decade
(ISM New Orders 3-month moving average, by phase)

Source: Bloomberg and Institute of Supply Management (ISM) as of 30 April 2021. For illustrative purposes only. We are not soliciting or recommending any actions based on this material.
Key investor takeaways
From an asset allocation perspective, a key reason credit is experiencing inflows and looking more attractive versus equities is that stocks are a valuation-dependent asset class: they are price return-driven assets that move up and down with the economy and offer minimal carry. The components of total return are critical, and as the price return in equities becomes exhausted, investors will start to favor interest-bearing assets like high yield bonds and other credit that offer more carry and don’t rely on the price return to provide a total return.
It’s also important to note, of course, that equities are riskier and more volatile, so investors will demand higher returns in exchange for that risk. At the point where growth starts to peak, expected returns for equity drop, but the volatility persists or worsens. Credit thus becomes more attractive because it can offer a similar (or better) return with less volatility.
All told, PMIs are signaling a phase in which credit assets in both developed and emerging markets look increasingly compelling – and may be poised to outperform other asset classes.
For more insights into developments moving credit markets, see “Fixed Income Snapshot: The Case for Leveraged Loans and High Yield Bonds When Rates Are Rising.”
Disclosure
Investing involves risk, including possible loss of principal. The information presented herein is for illustrative purposes only and should not be considered reflective of any particular security, strategy, or investment product. It represents a general assessment of the markets at a specific time and is not a guarantee of future performance results or market movement. This material does not constitute investment, financial, legal, tax, or other advice; investment research or a product of any research department; an offer to sell, or the solicitation of an offer to purchase any security or interest in a fund; or a recommendation for any investment product or strategy. PineBridge Investments is not soliciting or recommending any action based on information in this document. Any opinions, projections, or forward-looking statements expressed herein are solely those of the author, may differ from the views or opinions expressed by other areas of PineBridge Investments, and are only for general informational purposes as of the date indicated. Views may be based on third-party data that has not been independently verified. PineBridge Investments does not approve of or endorse any republication of this material. You are solely responsible for deciding whether any investment product or strategy is appropriate for you based upon your investment goals, financial situation and tolerance for risk.

Fixed Income
Discover PineBridge’s range of fixed income offerings
Recent Insights


