The Case for Collateralized Loan Obligations for Global Insurers

Vladimir Zdorovenin, PhD
Head of International Insurance Solutions

Laila Kollmorgen, CFA
Global Head of CLO Tranche Investments, Portfolio Manager
CLOs are prepared to weather market headwinds. We expect credit tightening to drive high yield and leveraged loan default rates from current historical lows to 3%-4% in 2023 and marginally higher in 2024. However, we believe that senior CLO tranches are well positioned for this environment and favor rotating down the capital stack into lower-rated tranches when spreads have widened further and when central banks are more likely to pivot and reduce interest rates.
An attractive risk/return profile for insurers. In an environment of rising and volatile interest rates, CLOs offer insurers wider spreads, lower interest rate sensitivity, and historically lower credit losses and stressed mark-to-market returns compared to same-rated corporates.
Capital efficiency for most, but not all. Wider spreads on CLOs come at the cost of higher risk-based capital requirements relative to same-rated corporates. Insurance investors are well rewarded for allocating capital to CLO investments under most capital regimes – but not under the Solvency II standard formula. Multinational insurers can further improve the efficiency of their CLO investments by adopting solutions tailored to the specifics of their local balance sheets.
A growing appetite for CLOs. US CLOs continue to be one of the fastest-growing allocations on US insurers’ balance sheets. Rising interest rates and an increased emphasis on asset liquidity are fueling demand for floating-rate CLO tranches. Even in lower interest rate environments, CLOs continue to be attractive due to wider spreads and historically better default/loss performance compared to similarly rated corporate bonds.

Insurers’ investments were battered last year by an unprecedented spike in interest rates and volatile bond and equity markets – and credit risk in insurers’ fixed income portfolios is in the spotlight as credit conditions tighten, raising the risks of an economic slowdown and higher default rates. Yet even against this backdrop, we believe high-quality CLO tranches can be a compelling proposition for insurers: the potential for higher spreads, lower default losses, shorter interest rate duration, and broader diversification, all while maintaining adequate liquidity in their holdings, are attractive benefits.
The higher yields on CLO tranches typically come with higher capital requirements. Expanding on an earlier commentary focused on US insurers, here we consider the regulatory and rating capital requirements for global insurers under multiple regimes, with expected returns on US dollar-denominated investments hedged into several major currencies. With the notable exception of the Solvency II standard formula approach, CLOs exhibit higher capital efficiency than same-rated corporates under most regimes, making them a useful tool for improving balance sheet efficiency.
Return on capital is not the sole driver of insurers’ asset allocations. An insurance investment officer will seek higher returns within a risk-based capital budget while balancing considerations including portfolio liquidity, diversification, sustainability, income generation, and asset-liability management (ALM), among others. We believe the expected return on required capital is a transparent and meaningful measure of the relative value of CLOs for insurers’ balance sheets – and that customized solutions can help address the full complexity of insurance investment decision-making.
Market Outlook: Positioning in CLOs as Financial Conditions Tighten
We have favored risk-off portfolio construction since the beginning of 2023, anticipating greater equity and bond market volatility. While we had not foreseen the US regional bank failures and the demise of Credit Suisse, we believed the rapid hikes in interest rates by central banks in the US, the UK, and Europe would tighten financial conditions, which would in turn have a negative impact on companies, the economy, and employment down the road. Amid these market conditions, we expect high yield and leveraged loan defaults to increase from current historical lows (1.32% and 0.44% in the US and Europe, respectively) to 3%-4% in 2023 and marginally higher in 2024.
Against this backdrop, we favor positioning CLO portfolios conservatively, in the more senior tranches (AAA, AA, and A), looking to rotate down to lower rating tiers when spreads have widened further and when central banks appear more likely to pivot and reduce interest rates.
The Case for CLOs for Insurers
Insurers investing in CLOs have the potential to achieve higher yield due to CLOs’ higher complexity, lower liquidity compared to investment grade (IG) corporates (but similar to that of other securitization types and sub-IG debt), and prepayment risk, rather than for higher volatility or default risk. Allocating to CLOs could help insurers diversify their fixed income holdings, increase yields, and improve resilience to market stresses.1 Under several major risk-based capital (RBC) regimes (Solvency II standard formula being the exception), insurers could benefit from a higher return on required capital when investing in CLOs than in comparable corporates.
Spread pickup over comparable corporates
US CLOs offer a significant and persistent pickup in spread over same-rated US corporates (see Figure 1). In our view, persistent interest rate volatility and uncertainty about the future path of policy rates make floating-rate CLOs an attractive alternative to longer-duration investment grade corporates, which represent a significant portion of insurers’ investments.
Figure 1: CLOs Offer a Compelling Spread Pickup Over Comparable Corporates
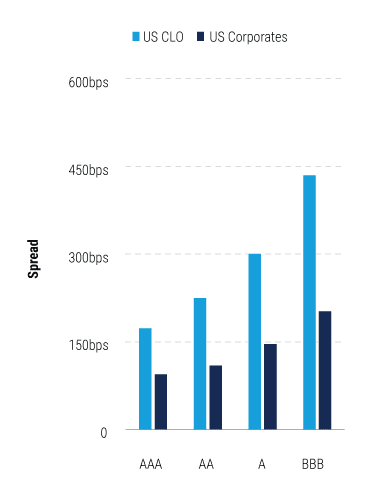
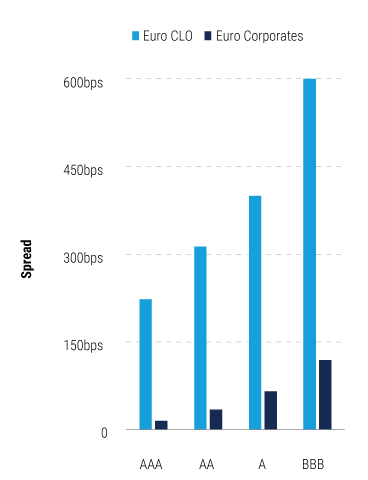
Sources: JP Morgan, ICE Index Platform, Bloomberg as of 28 April 2023; PineBridge Investments analysis. Risk resilience and diversification
In the aftermath of the global financial crisis (GFC), CLOs issued before the downturn demonstrated greater stress resilience than same-rated corporates. And on a total return basis, extreme losses over the past decade for investment grade CLOs have been significantly lower than for same-rated corporates (see Figure 2). This is also the case for credit spread returns isolated from the impact of interest rate movements – a relevant perspective for life insurers that actively manage their net asset-liability duration exposure.
Figure 2: Extreme Losses Have Been Much Lower for IG CLOs Than for Same-Rated Corporates
Historical extreme market losses: 2013-2023
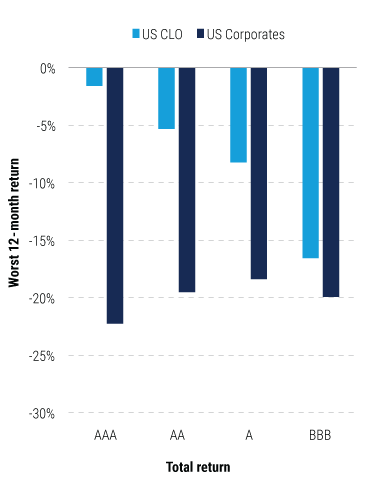
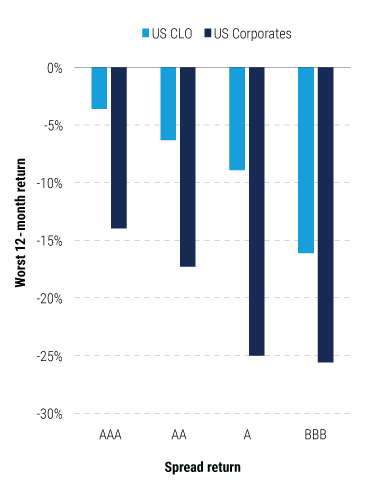
Source: JPMorgan, ICE Index Platform as of 31 March 2023, PineBridge Investments analysis. Worst-12-month return is the minimum return on the relevant reference index over a rolling 12-month period. Total returns are reported by data providers. Spread return for US corporates is the excess swap return reported by ICE Index Platform. Spread return for US CLO is PineBridge Investments’ estimate based on index duration and spread as reported by JPMorgan. Based on monthly values from December 2012 to February 2023.
For total-return investors, such as property and casualty (P&C) insurers, the imperfect correlation between CLO spreads and bond yields suggests that a higher allocation to CLOs could improve portfolio diversification. The worst-12-month post-GFC loss on investment grade corporates (measured on a total return basis) was driven by the sharp rise in interest rates over the course of 2022. The worst loss on US CLOs in February-March 2020 was driven by spread widening in response to the impact of Covid-19. A higher allocation to CLOs would have helped insurers smooth the total return on their fixed income portfolios.
Low credit loss rates across all CLO tranches
The credit risk tranching and senior secured status of the underlying loans in senior CLO tranches provide strong protections for investors: There have been no credit losses on AAA to A rated CLO tranches rated by Moody’s since at least 1993. Historical credit losses on high yield tranches are also significantly lower than those on same-rated corporates (see Figure 3).
Figure 3: Credit Loss Rates for CLO Tranches Have Been Low vs. Corporate Debt
Historical average five-year cumulative credit loss rates on CLOs versus corporates
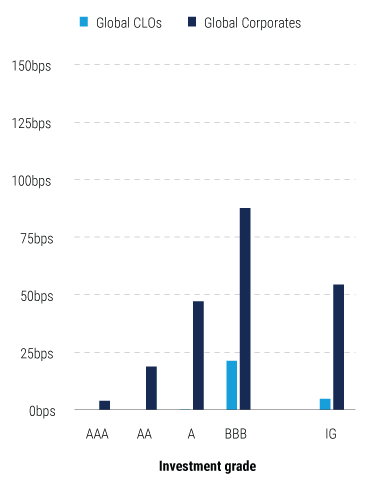
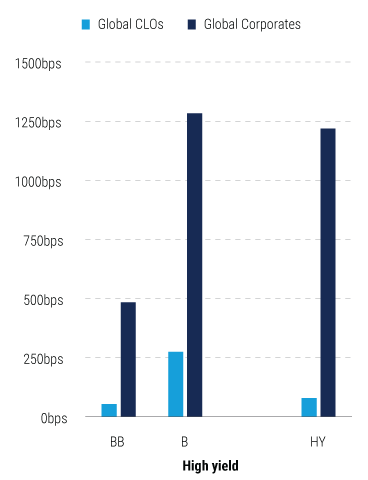
Source: Moody's Investor Service (15 June 2022) Impairment and loss rates of global CLOs: 1993-2021; Moody’s Investor Service (28 January 2021) Annual default study. PineBridge Investments interpretation.
European Securitization Regulation: Risk Retention and Transparency Requirements
European investors in securitization assets (including CLOs) face several requirements under the European Banking Authority Securitisation Regulation (SecReg).2 The main requirements are risk retention (SecReg Article 6) and transparency (SecReg Article 7).
Article 6: Risk Retention
CLO managers are required to retain no less than 5% of the material net economic interest in the transaction on an ongoing basis. This requirement has been in effect for European investors since January 2011. The entity retaining the 5% net economic interest must be deemed an originator or sponsor of the CLO. These are definitions in which a manager must decide how to comply. Once that decision is made, the CLO manager either “originates” or “sponsors” the securitization of loans and bonds that comprise the portfolio backing a CLO.
Article 7: Transparency Requirements
The originator or sponsor of the CLO must make certain information relevant to the transaction available to investors, potential investors, and regulators. While many US CLO managers complied with several aspects of Article 7 prior to October 2022, the EU Commission published a report that clarified the requirements and instructed the European Securities and Markets Authority (ESMA) to create templates that will apply to all European and US CLOs that aim for EU risk retention compliance. The requirements include disclosure of transaction documentation, quarterly asset and payment date reporting, and further reports regarding anything significant to the CLO and underlying assets.
In the Tranches: Insurers’ CLO Investments
US insurers’ CLO investments have doubled in recent years
US insurers reported US$216 billion of CLO investments at year-end 2021, representing approximately 25% of the US$856 billion of outstanding US CLOs. This marks an increase of about 12% year-over-year and more than double the US$95 billion of CLOs held at the end of 2016.3 While CLOs still represent a modest portion of insurers’ investments, this allocation is among the fastest-growing, increasing from 1.5% to 2.7% over the 2016-2021 period.
Most CLOs are held by large life insurers that partner with specialized asset managers or develop relevant investment expertise in-house. At the end of 2021, the top 10 US life insurance groups accounted for over 40% of industrywide holdings. US insurers allocate across the spectrum of investment grade CLO tranches: AAA rated tranches account for 40% of insurer holdings and 68% of the broader market (see Figure 4).
Figure 4: US Insurers Allocate to CLOs Across the Full Credit Quality Spectrum
US insurers’ CLO holdings by credit rating (year-end 2021)
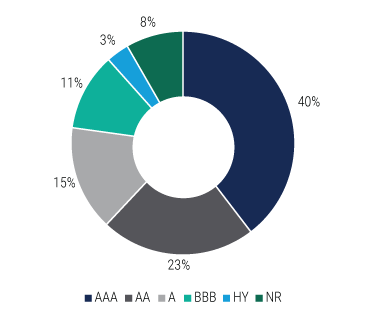
Source: US NAIC as of year-end 2021, at book/adjusted carrying value.
US CLO market value by credit rating (year-end 2021)
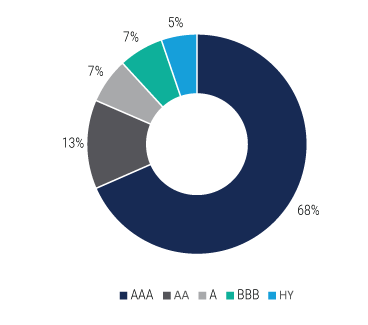
Source: JPMorgan Markets CLO composite by rating bucket as of 31 December2021, at market value.
While industry statistics for year-end 2022 were not available at the time of writing, anecdotal evidence suggests that some US insurers took advantage of the opportunity presented by the 2022 market dislocation to further increase their CLO allocations.4
European insurers’ growing appetite for CLOs
European insurers’ disclosures do not provide a clear picture of their CLO holdings, but anecdotally, CLOs represent a small proportion of insurers’ investments. Under the Solvency II standard formula, insurers face prohibitively high spread risk capital requirements for CLO investments unless they can classify them as “senior STS securitizations” – a designation that most CLOs do not meet. Internal-model insurers (typically, large life insurers and reinsurers) tend to focus on mortgage debt securitizations rather than CLOs.
As of second quarter 2022, the €50.3 billion of collateralized securities (including CLOs)5 held on Europe Economic Area insurers’ balance sheets accounted for 0.9% of their €5.4 trillion general account investments,6 compared with €38.1 billion in the second quarter of 2018. Large insurers (particularly those using internal models) often have higher allocations to collateralized securities (up to 5% of investments). However, their portfolios consist mostly of mortgage-backed securities (MBS) and collateralized mortgage obligations (CMOs), with a modest share of CLOs.
Risk-Based Capital Considerations for Insurers
Capital requirements can vary substantially
Insurers navigate multiple sets of capital requirements when making investment decisions. National regulators set capital requirements for insurers under their supervision, typically calculated using a jurisdiction-specific standard formula. Beginning in 2025, internationally active insurance groups (IAIGs)7 will also be required to meet risk-based capital requirements calculated under the International Association of Insurance Supervisors (IAIS) Insurance Capital Standard (ICS). Rated insurers and reinsurers must meet the requirements of the rating agency’s insurance capital model. In addition, many larger insurers use internal models to quantify and manage economic capital or to meet regulatory requirements (for example, under the EEA and UK Solvency II internal model approach).
Under most risk-based regimes, securitizations (including CLOs) are recognized as a separate asset category that carries higher capital charges than comparable corporate bonds. Under all regimes, lower-rated credit investments are subject to higher capital requirements; under most regimes, capital requirements also increase with the spread duration (or maturity) of the debt, penalizing exposures to longer-dated credit.
The requirements for CLO investments under several national RBC regimes, as well as S&P’s risk-based insurance capital model and the forthcoming global IAIS ICS, are summarized in Figure 5 below.8
Figure 5: Capital Treatment of CLO Tranche Investments
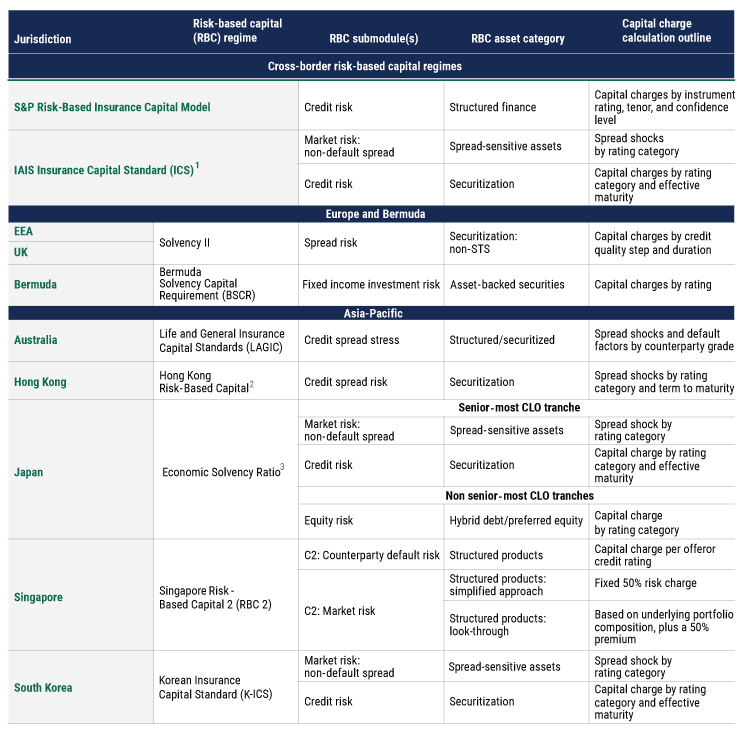
1Currently in confidential monitoring phase; full adoption expected in 2024 Q4. 2Currently in voluntary early adoption phase. 3Currently in field testing phase; full adoption expected in 2025.
Sources: S&P Global Ratings (6 December 2021) Request For Comment: Insurer Risk-Based Capital Adequacy--Methodology And Assumptions; International Association of Insurance Supervisors (March 2020) Level 2 Document: ICS Version 2.0 for the monitoring period; Australian Prudential Regulation Authority (30 June 2022) Prudential Standard GPS 114 Capital Adequacy: Asset Risk Charge; Bermuda Monetary Authority (6 December 2021) 2021 BSCR Model; European Commission Delegated Regulation (EU) 2015/35 (recast 2 August 2022); Hong Kong Insurance Authority (2021) Hong Kong Risk Based Capital Early Adoption: Technical Specifications; Monetary Authority of Singapore Notice 133 (amendment no. 2; 19 December 2022); South Korea Financial Supervisory Service보험업감독업무시행세칙 (revised 8 March 2023); Japan Financial Services Agency (August 2022) 経済価値ベースの 評価・監督手法の検討 に関する フィールドテスト. PineBridge Investments interpretation and analysis.
Capital efficiency: a strong benefit in most regimes
We quantify insurance regulatory capital efficiency of US CLOs relative to domestic corporates across major currencies and risk-based capital regimes. In most cases, investment grade US CLOs offer a higher expected return on capital than same-rated corporates (see Figure 5).
The notable exception is European and UK insurers operating under the Solvency II standard formula. Prohibitive spread risk capital charges on non-STS securitizations leave these firms at a relative disadvantage compared to their global peers. For the largest European and UK insurers operating under Solvency II internal models, regulatory capital requirements can be better aligned with the economic risk of their investments and the relevant historical experience. However, even for standard-formula firms, CLOs may still represent an attractive opportunity given the combination of higher spreads and lower historical losses compared to corporates.
We derive expected return on regulatory capital as the ratio of expected spread return to risk-based capital:
Expected spread return is the benchmark index spread, net of:
Annualized Moody’s five-year historical average credit loss
Typical asset management fees
Annualized expected spread impact of foreign exchange (FX) hedging for non-US investors over the life of the investment9
Risk-based capital is the capital requirement for investment risk (spread and credit risk) estimated using the credit rating and spread duration of the benchmark index.
Within each jurisdiction, we assess the relative value of US CLOs by comparing the expected return on regulatory capital to that of domestic investment-grade corporates.10 Direct comparisons between jurisdictions are not always meaningful, as insurers target different capital adequacy ratios under different RBC regimes.11
Internationally active insurance groups must navigate multiple RBC regimes
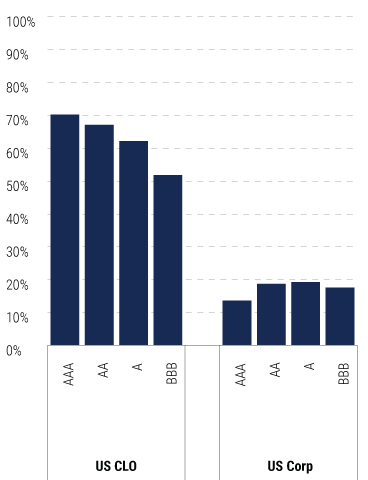
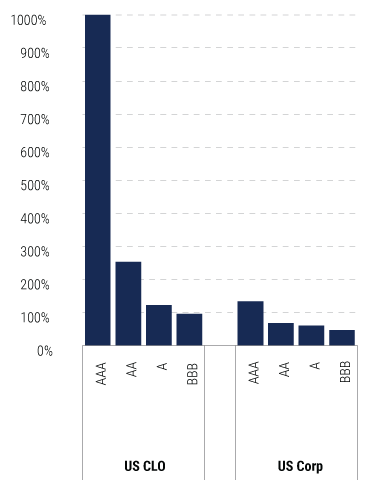
Internationally active insurance groups (IAIGs) face multiple risk-based capital requirements, including IAIS ICS (for eligible IAIGs), rating agency capital requirements, and potentially Bermuda SCR requirements for their offshore reinsurance entities (see Figure 6).
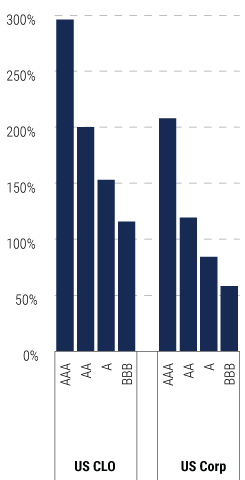
Figure 6: Expected return on capital –Internationally Active Insurers
USD - ICS
USD - S&P 99.8%
Sources: JP Morgan, ICE Index Platform, Bloomberg as of 28 April 2023; PineBridge Investments analysis. Expected return on capital is the ratio of expected spread return (i.e., benchmark index spread net of historical average credit losses and typical asset management fees) to risk-based capital requirement for investment risk.
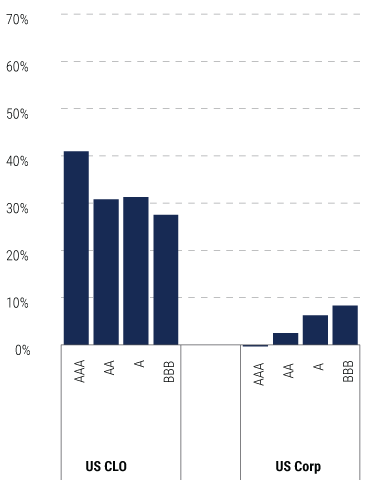
Under the ICS regime, the incremental capital requirements for lower-rated debt investments are broadly in line with the incremental increase in spreads. As a result, CLO tranches rated from AAA to BBB are expected to earn broadly similar returns on capital, consistently above those of same-rated US corporates. A different pattern holds for Bermuda, where higher-rated debt investments would benefit from a higher expected return on capital – but CLOs would still be more capital-efficient than corporates. Under S&P’s insurance capital model, higher-rated fixed income investments carry much lower capital charges, implying higher returns on capital for AAA rated CLO tranches.
To build capital-efficient portfolios, internationally active insurers must carefully balance their investment decisions against multiple sets of capital requirements. Partnering with a specialized asset manager that has a holistic understanding of the group’s balance sheet, as well as expertise and experience in key jurisdictions, can help.
European insurers
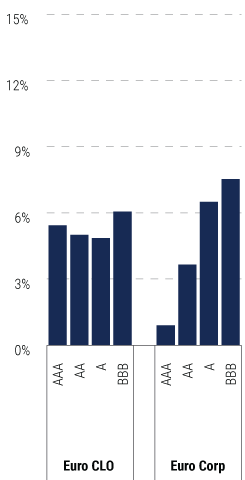
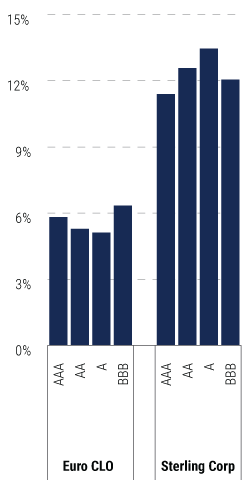
For EEA and UK insurers operating under the Solvency II standard formula and hedging their foreign-currency investments back into the euro or sterling, US CLOs are typically classified as “non-STS” securitizations with prohibitively high spread risk capital charges – as much as 50%-100% for lower-rated or longer-dated tranches (see Figure 7).
Figure 7: Expected return on capital – EEA, the UK, and Bermuda
EUR (hedged) - SII
GBP (hedged) - SII
USD - BSCR
Sources: JP Morgan, ICE Index Platform, Bloomberg as of 28 April 2023; PineBridge Investments analysis. Expected return on capital is the ratio of expected spread return (i.e., benchmark index spread net of historical average credit losses, expected impact of FX hedging on hedged spread, and typical asset management fees) to risk-based capital requirement for investment risk.
Eurozone insurers face persistently low spreads on high-quality domestic corporate bonds and may therefore find higher-rated, shorter-dated US CLO tranches an attractive building block for their fixed income portfolios, given the combination of spread pickup, secondary market liquidity, and low historical credit losses.
UK insurers enjoy higher spreads on domestic investment grade corporates than their eurozone peers, which somewhat weakens the relative-value case for CLOs for standard-formula UK firms. Internationally active UK insurers and reinsurers operating under the Solvency II standard formula may find that their CLO investments could fit better on their overseas balance sheets.
While individual insurers are not required to disclose their internal model calibrations, CLOs may also be capital-efficient under Solvency II internal models. Internal-model firms can align the regulatory capital requirements for their CLO investments by calibrating their tail risk models to post-GFC CLO returns, applying a look-through to the underlying pools of loans, or both.
Asia-Pacific insurers
Large Asia-Pacific (APAC) insurers operate across multiple jurisdictions. Local business units report in the local currency and meet local capital requirements; groupwide capital requirements are imposed on the consolidated balance sheet by group regulators and rating agencies. The scarcity of high-quality local-currency corporate debt incentivizes insurers to look for spread assets abroad. At the same time, the cost of currency risk hedging can create headwinds for foreign-currency investments.
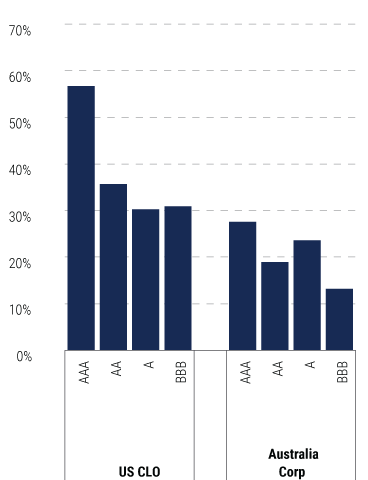
Against this complex backdrop, we find a persistent pattern across multiple APAC markets: US CLOs offer a significant pickup in expected return on regulatory capital over comparable corporates and could therefore be used to enhance insurers’ spread income in a capital-efficient manner (See Figure 8). While bespoke solutions may be required to address jurisdiction- or company-specific regulatory or ALM challenges, the reward is likely worth the effort.
Figure 8: Expected return on capital - Asia-Pacific
JPY (hedged) - Japan ESR
AUD (hedged) - LAGIC
HKD (hedged) - HK RBC
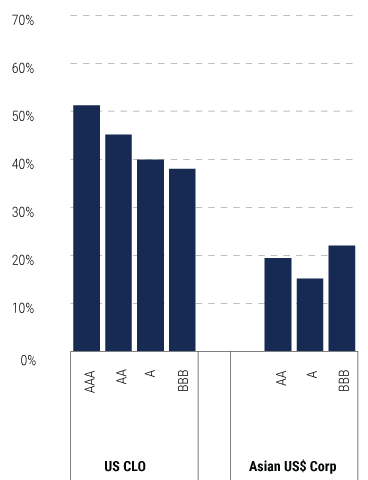
KRW (hedged) K-ICS
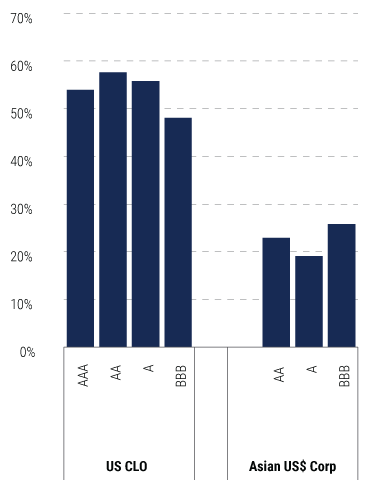
Sources: JP Morgan, ICE Index Platform, Bloomberg as of 28 April 2023; PineBridge Investments analysis. Expected return on capital is the ratio of expected spread return (i.e., benchmark index spread net of historical average credit losses, expected impact of FX hedging on hedged spread, and typical asset management fees) to risk-based capital requirement for investment risk.
CLOs are a compelling option for global insurers
While market headwinds are building, we believe senior CLO tranches are well positioned to withstand an uptick in defaults on underlying loans, and that lower-rated tranches may look attractive once spreads have widened further and central banks look set to pivot.
CLOs offer insurers wider spreads, lower interest rate sensitivity, and historically lower credit losses and stressed mark-to-market returns compared to same-rated corporates – an attractive risk/return profile for many insurers.
While wider spreads on CLOs come at the cost of higher RBC requirements relative to same-rated corporates, allocating capital to CLO investments can reward insurers under most capital regimes – the exception being those under the Solvency II standard formula. Yet multinational insurers improve the capital efficiency of their CLO investments by adopting solutions that are tailored to their local balance sheets.
Already one of the fastest-growing allocations on US insurers’ balance sheets, we expect insurers’ appetite for CLOs to keep growing globally as rising interest rates and an increased emphasis on asset liquidity fuel demand for floating-rate tranches. Across all interest rate environments, CLOs continue to be an attractive option for insurers due to their wider spreads and better default/loss performance compared with similarly rated corporate bonds.
Footnotes
1 For more on using CLOs as a building block for US insurers’ portfolios in the current rate environment, see PineBridge Investments Insights (8 March 2023) How ‘Credit Barbell’ Approaches Can Help Insurers Ride Out the Inverted Yield Curve
2 Regulation (EU) 2017/2402 (SecReg) of the European Parliament and of the Council of 12 December 2017 laying down a general framework for securitisation and creating a specific framework for simple, transparent and standardised securitisation, and amending Directives 2009/65/EC, 2009/138/EC and 2011/61/EU and Regulations (EC) No 1060/2009 and (EU) No 648/2012
3 US National Association of Insurance Commissioners (NAIC) Capital Markets Bureau (15 September 2022) U.S. Insurers’ CLO Exposure Continues Double-Digit Increase for Year-End 2021 Albeit at a Slower Pace; US NAIC (27 September 2018) U.S. Insurance Industry Exposure to Collateralized Loan Obligations Update as of Year-End 2017.
4 E.g., see Financial Times (2 November 2022), Apollo was a major buyer in UK pension fund fire sale.
5 Insurers’ allocations to CLO funds are not reported in EIOPA statistics – they comprise a part of “investments in collective investment undertakings.” Some insurers disclose the composition of their securitization investments in their annual reports and investor presentations.
6 Source: EIOPA Insurance Statistics - Group Quarterly Balance Sheet, as of 7 February 2023.
7 IAIS defines IAIGs as those with premiums written in three or more jurisdictions, the percentage of gross premiums written outside the home jurisdiction of at least 10% of the group's total gross written premium, and total assets of at least US$50 billion or gross written premiums of at least US$ 10billion (on a three-year rolling basis).
8 In addition to investment risk capital charges reported in Figure 4, insurers hold capital against currency and interest rate risk – these are calculated over the aggregate asset and liability exposures, rather than on individual positions.
9 Local-currency hedged spread is calculated as the spread on the local-currency leg of a hypothetical cross-currency swap of US CLO cash flows. The swap is initiated at zero value and priced using market rates reported by Bloomberg as of 28 February 2023. While insurers often hedge their foreign-currency exposures using three-month rolling FX forwards, our approach gives a no-arbitrage estimate of the expected cost of hedging over the lifetime of the investment.
10 In absence of suitable local-currency investment grade bond indices, we use currency-hedged Asian Dollar Credit to represent “local” corporate debt investments for insurers in Hong Kong and South Korea. For Japanese insurers, JPY-denominated corporate bonds account for a small proportion of fixed income investments; for these insurers, we compare US CLOs with US corporates.
11 Average capital adequacy ratio for EEA insurers under Solvency II is 225% as of year-end 2021 (EIOPA Statistics); aggregate NAIC RBC ratio for US life insurance companies is about double that at 450% (Fitch, April 2022); early adopters of Hong Kong RBC report capital adequacy ratios of about 275%-300% (according to company disclosures).
Disclosure
Investing involves risk, including possible loss of principal. The information presented herein is for illustrative purposes only and should not be considered reflective of any particular security, strategy, or investment product. It represents a general assessment of the markets at a specific time and is not a guarantee of future performance results or market movement. This material does not constitute investment, financial, legal, tax, or other advice; investment research or a product of any research department; an offer to sell, or the solicitation of an offer to purchase any security or interest in a fund; or a recommendation for any investment product or strategy. PineBridge Investments is not soliciting or recommending any action based on information in this document. Any opinions, projections, or forward-looking statements expressed herein are solely those of the author, may differ from the views or opinions expressed by other areas of PineBridge Investments, and are only for general informational purposes as of the date indicated. Views may be based on third-party data that has not been independently verified. PineBridge Investments does not approve of or endorse any republication of this material. You are solely responsible for deciding whether any investment product or strategy is appropriate for you based upon your investment goals, financial situation and tolerance for risk.


