Where in the World Are Your Returns Coming From?

Rob Hinchliffe, CFA
Portfolio Manager, Head of Global Sector Cluster Research

Michael Mark
Client Portfolio Manager, Equities

A frequent question from investors is: “Where do you invest?” or “Where do you see the most opportunities?” More often than not, they are looking for a straightforward answer – typically a region or market to focus on.
Yet, just like sectors, geography is another case where standard classifications can obscure more than they reveal. In many previous articles, we have discussed why we group companies by lifecycle stage rather than by sector. This approach gives us a truer read on growth prospects and a sharper lens for spotting mispricings that are likely to correct over the next three to five years – one of our most consistent sources of alpha historically (click here to learn more about how our lifecycle approach works).
Geography, like sectors vs. lifecycles, can be a head fake – and an alpha source. For instance, one UK-listed company, a leading provider of thread and other components for clothing and footwear, derives 0% of revenues from the UK or Europe. Forty percent of its sales come from China, Vietnam, and India, followed by more minor splits in the US and Japan. By domicile, it’s “British.” By economics, it’s anything but. That’s why we use FactSet GeoRev to map exposures to where companies actually earn their money. In the short term, market sentiment may tug this company’s share price with the UK, but over time returns converge toward the true drivers, its end markets.
After years of US outperformance, Mag 7 dominance, and dollar strength, equity investors are asking whether “all-in US” still makes sense given high valuations, a weakening dollar, and political instability. We take comfort in knowing that when you look through to revenues, exposures are often very different than they appear – and that’s part of the point.
A kind of MRI for the MSCI
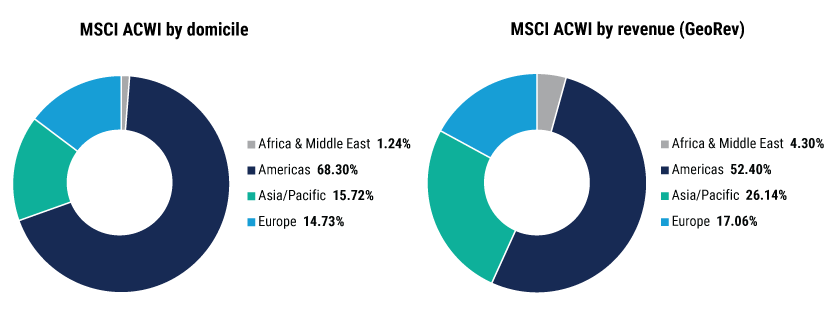
A domicile view of the MSCI ACWI suggests an epic level of US dominance. The US represents nearly two-thirds of the benchmark by domicile. Within that US share, the seven largest companies – Apple, Microsoft, Alphabet, Amazon, Nvidia, Meta, and Tesla – account for about a fifth of ACWI by market cap. Nvidia itself has grown so large that it eclipses the market value of the largest national markets outside the US. Concentration has never been higher, leaving many investors feeling exposed.
But when measured by revenue, the US share shrinks closer to half – still large, to be sure, but not as unsettlingly so. On the flip side, emerging markets (EMs) jump from just over 10% by domicile to roughly 40% by revenue.
A quick visual scan helps: Where companies sit (domicile) and where they sell (revenues) tell very different stories.
Where the Money Is: How We Look at Geographical Exposures

Source: FactSet Geographic Revenue (GeoRev) data as of 29 August 2025. Note: Here, FactSet groups the US with Canada and Latin America as “Americas.” We find this cleaner, more parallel with the other regions, and consistent with US companies’ dominance of the regional market cap and their close ties to their neighbors through customers and supply chains. Emerging markets are not broken out separately in this view, though we sometimes do in other analyses.
Active managers and misperceptions
The contrast between domicile and GeoRev exposures can be even more pronounced for certain active managers. Many managers keep their country weights tightly aligned with the benchmark, so their portfolios look index-like no matter the lens. By contrast, higher-conviction managers may differentiate themselves through stock selection that shows up in a domicile view as a “big country bet,” but looks far more balanced once revenues are considered.
As with grouping companies by lifecycles instead of sectors, this differentiated lens becomes another way to raise active share while, ironically, keeping tracking error low. Investors who stop at domicile weights may worry they are making unintended regional bets, when in fact the underlying exposures – to customers, currencies, and costs – tell a more nuanced story.
Why it matters
Why is all this so important? Markets continue to be whipsawed by currency shifts, tariff threats, and political headlines. A domicile-based lens tells you how such forces can influence flows and sentiment and move prices in the short term, but not where companies truly earn and spend. Revenue-based analysis better links portfolio exposures to fundamentals.
The current debate over US equities illustrates this tension well. Years of outperformance, dollar strength, and Mag 7 dominance have left global portfolios heavily weighted to the US. Yet, S&P 500 companies earn more than half of their revenues abroad, meaning that “US exposure” in domicile terms is not the same as exposure to the US economy – whether to its tailwinds or its headwinds.
Case study: Connecting the US, China, and Europe
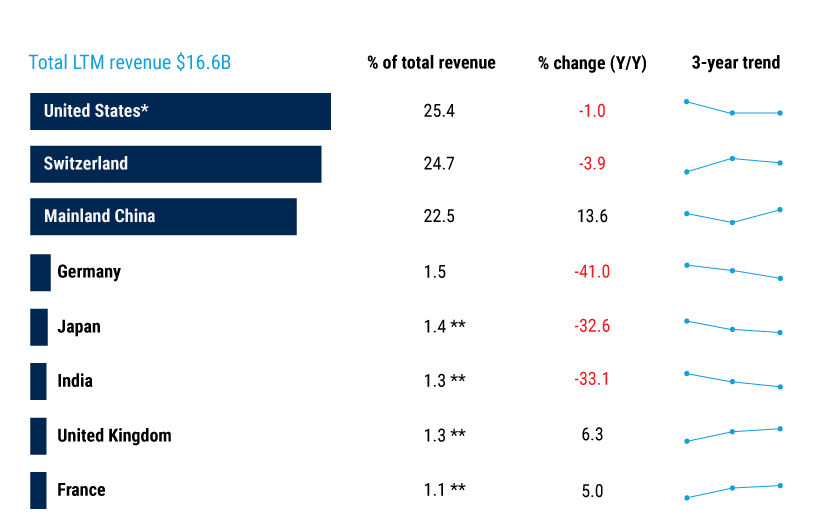
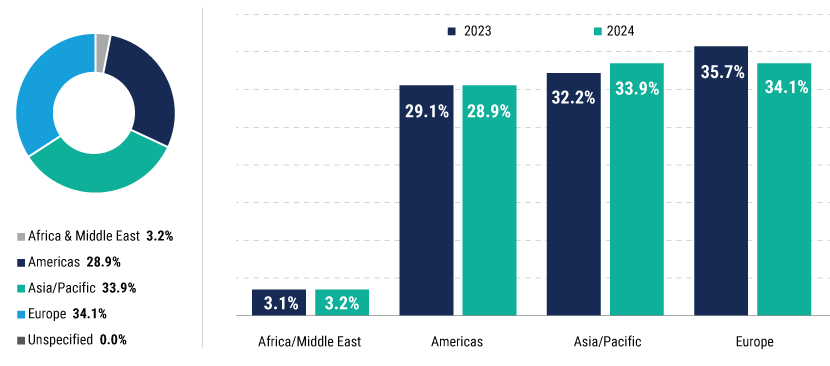
Consider a multinational supplier of sensors and connectors critical for electric vehicles, 5G equipment, and industrial automation. Officially domiciled in the US, the company earns roughly an equal amount of revenue in the US, China, and Europe. In China, the business is well positioned to ride EV growth and autonomous driving. In the US, it faces turbulence from flagging EV sales but benefits from demand for industrial automation and robotics as companies counter higher costs and tariffs. In Europe, its connectors are essential to next-generation telecom networks.
Plugged In: A US-based Connectivity Company Through the GeoRev Lens
Revenue exposure by country/region

Revenue exposure by super-region

Source: FactSet Geographic Revenue (GeoRev) data as of September 2024. *Country of domicile showing up to eight of 125 counties. **Value is estimated based on FactSet’s proprietary algorithm.
The opportunities and risks vary dramatically by geography. None of this shows up if you stop at “US-domiciled.” This example illustrates how a single company can simultaneously be tied to consumer growth in China, industrial modernization in the US, and digital infrastructure buildouts in Europe.
That’s why we anchor our analysis to end-market revenues, not mailing addresses, because that’s where cash flows, and ultimately returns, come from.
Looking ahead
The US will remain a vital source of innovation and market leadership, with deep capital markets, the world’s largest consumer base, and high governance standards. But just as sectors can mislead and domiciles can disguise exposures, we expect US opportunities will look different when viewed through the lenses of lifecycles and revenues. That’s where mispricings emerge, and where active managers can continue to find alpha others don’t see.
Disclosure
Investing involves risk, including possible loss of principal. The information presented herein is for illustrative purposes only and should not be considered reflective of any particular security, strategy, or investment product. It represents a general assessment of the markets at a specific time and is not a guarantee of future performance results or market movement. This material does not constitute investment, financial, legal, tax, or other advice; investment research or a product of any research department; an offer to sell, or the solicitation of an offer to purchase any security or interest in a fund; or a recommendation for any investment product or strategy. PineBridge Investments is not soliciting or recommending any action based on information in this document. Any opinions, projections, or forward-looking statements expressed herein are solely those of the author, may differ from the views or opinions expressed by other areas of PineBridge Investments, and are only for general informational purposes as of the date indicated. Views may be based on third-party data that has not been independently verified. PineBridge Investments does not approve of or endorse any republication of this material. You are solely responsible for deciding whether any investment product or strategy is appropriate for you based upon your investment goals, financial situation and tolerance for risk.

