2024 Emerging Market Sovereigns Outlook: Key Drivers Signal a Stronger Year
After being buffeted by external and cyclical headwinds over the past two years, EM sovereigns look set for a stronger 2024.
Cyclical and external trends are particularly positive in the first half of this year, with some caution warranted heading into the second. While the Fed’s rate cuts will have the dominant hand, slowing China growth could sour EM sentiment somewhat in the second half, and we expect an uptick in oil prices to $80-$85 per barrel.
Structural shifts such as near-shoring will remain constructive well beyond 2024, and we calculate that the wide positive buffer between emerging and developed market growth differentials will hold for at least the next two to three years.

Emerging market sovereigns are poised for a strong start to 2024. Continued improvement in structural and domestic trends, including green industry investment and near-shoring momentum, bode well for the asset class, and improved drought conditions and rate cutting cycles are among the positive cyclical forces providing tailwinds. While we’ve observed some decoupling of EM performance from external factors such as developed market rate moves, these outside drivers are still important – and they too are turning positive after having inflected pain over the past two years.
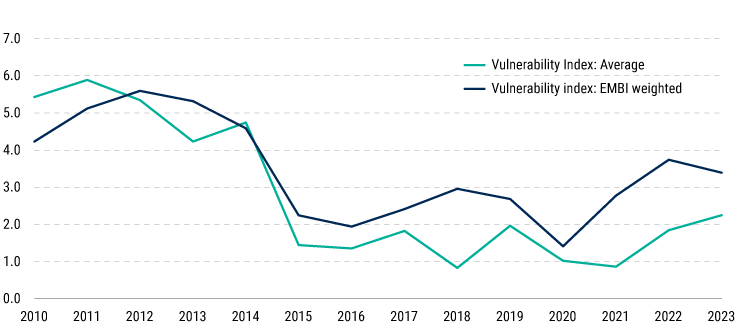
All told, the backdrop entering 2024 stands in stark contrast to the previous decade (2010-2020), when emerging markets were plagued by weak structural trends and were much more vulnerable to external and cyclical fluctuations.
Chart 1: EM Sovereigns on Stronger Footing Amid Rising Current Account Surpluses and Multilateral Debt
Source: Bloomberg, Macrobond, IMF, own calculations as of January 2024 *Higher index reflects lower vulnerability
The External Backdrop Is More Supportive
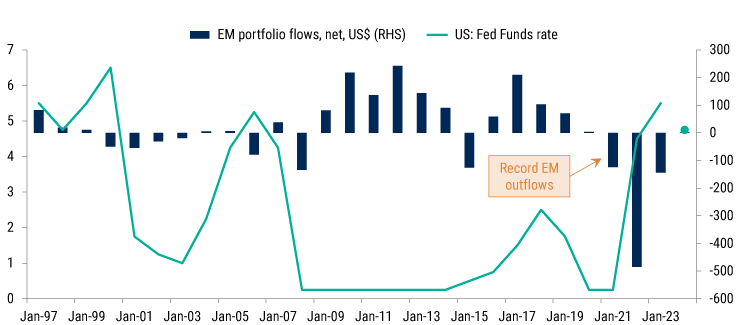
On balance, we expect the external backdrop for EM to improve in 2024. Portfolio flows are expected to return as the US Federal Reserve pivots toward rate cuts. EM sovereign bond indices endured record outflows over the past two years as the Fed swiftly hiked rates (see chart 2), leading to the current thin positioning. Encouragingly, if the US sidesteps a recession, the positive correlation would benefit EM spreads.
Chart 2: Even Mild US Fed Rate Cuts Could Help Stabilize EM Flows
Source: Macrobond, IMF, Bloomberg as of January 2024
An improving outlook for China bodes particularly well for EM in the first half. In the past two years, higher China growth has become more strongly correlated with lower EM spreads. At the same time, the formerly negative correlation between oil and the US dollar has turned positive, accentuating the impact on EM. These correlations should work in EMs’ favor in the first half of 2024.
Some caution is warranted heading into the second half, however. China’s growth is expected to slow to a roughly 4% cruise rate. While we don’t foresee large moves in either oil or the dollar, our projected range for oil is slightly higher, at $80-$85 per barrel. While the Fed’s rate cuts will have the dominant hand, slowing China growth could sour EM sentiment somewhat in the second half.
We believe commodity prices will remain sufficiently high to underpin a robust external environment for emerging markets. This is a more persistent, structural story than a cyclical phenomenon, driven by green industry investment, production automation, near-shoring, and rising defense spending, along with a nascent recovery in decade-low investment ratios. These developments seem to underpin the end of the down leg of the commodity supercycle that started in 2014. Indeed, despite lower industrial and precious commodity prices than the March 2022 peaks, price indices are still roughly 30% higher than 2019 averages.
Fundamentals: Defying DM Gravity
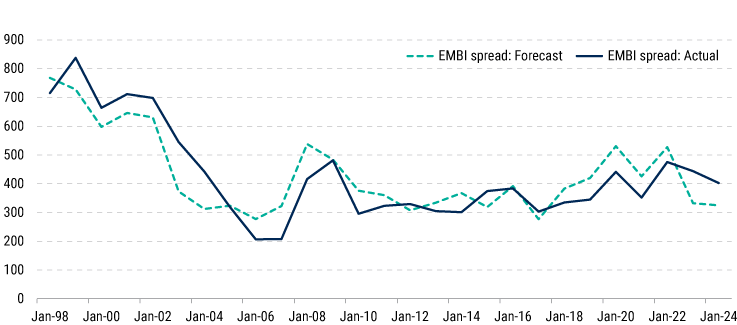
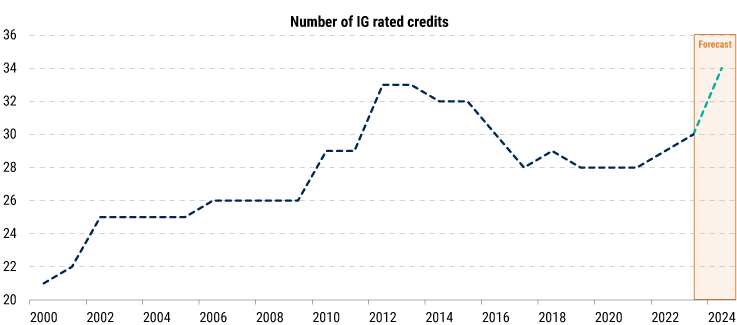
When assessing the main fundamental EM sovereign macro factors, it’s clear that creditworthiness should continue to improve – and this, in isolation, would justify narrower spreads (see chart 3) and higher returns. Indeed, as credit quality rises, it will be reflected in credit rating upgrades. After falling to a low of 28 in 2020, the number of investment grade EM sovereigns has since risen to 30 and is projected to reach a record high of 34 over the next two years (see chart 4).
Chart 3: Modeling EMBI Spreads on Three Main Fundamental Factors* Suggests Further Narrowing
Source: Macrobond, World Bank, IMF, PineBridge calculations as of January 2024. *EM growth differential, debt/GDP ratios, and institutional quality.
Chart 4: Investment Grade EM Sovereigns Are Poised to Reach a New High
Source: Moody’s Investor Services, own calculations as of January 2024
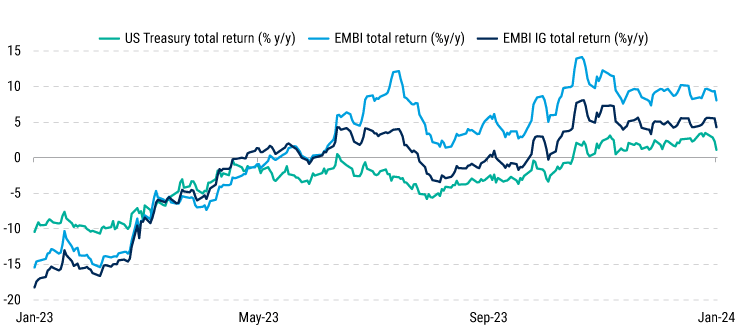
This trajectory explains, to a large extent, the decoupling effect that markets have witnessed, with EM hard currency bonds outperforming their DM counterparts (and with less volatility) despite witnessing massive outflows over the last year (see chart 5).
Chart 5: EMBI Total Returns Have Flipped the Script vs. Developed Markets
Source: Bloomberg as of January 2024
Assessing the Main Macro Factors
Growth in Emerging Markets Could Leave DMs in the Dust This Year
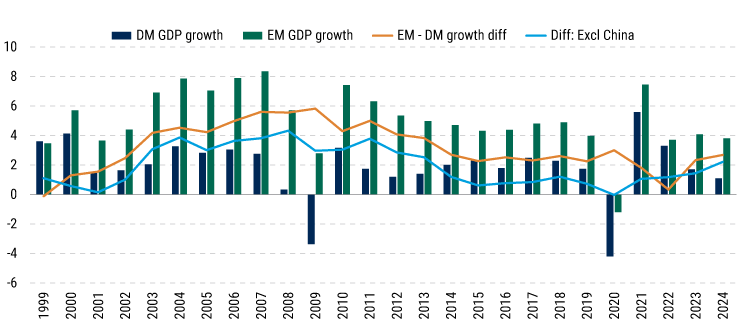
Both cyclical and structural factors will likely push the EM-DM growth differential in 2024 to its widest level since 2014 (excluding China). Out of the 70 sovereign credits we assess, 43 should see accelerating growth in 2024, while growth in developed markets is expected to slow (see chart 6).
Chart 6: Emerging Market Growth Is Projected to Pull Further Ahead This Year
Source: IMF, PineBridge calculations as of January 2024
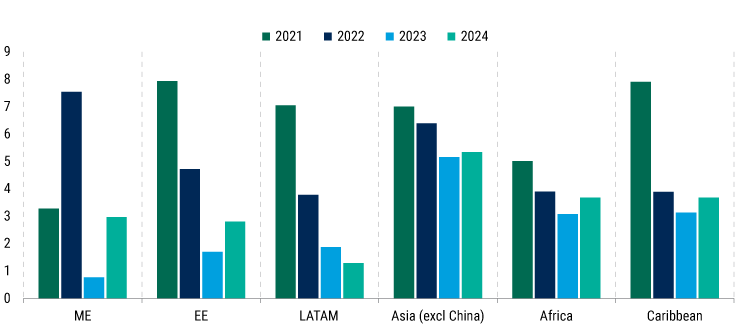
On a consolidated level, all regions but Latin America should see faster growth in 2024 (see chart 7). The downtrend in LatAm reflects slowing in Brazil and Mexico, though the latter is still growing above potential, and the remaining LatAm economies are expected to record faster growth.
Chart 7: Latin America Is the Only Outlier Amid Broadly Faster EM Growth
Source: IMF, PineBridge calculations as of January 2024
Any opinions, projections, forecasts, and forward looking statements presented are valid only as of the date indicated, are speculative in nature, and are subject to change
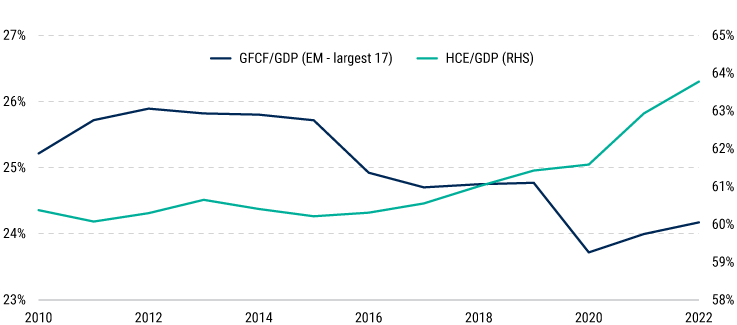
Structural reasons for faster growth include near-shoring, ESG-related impacts on commodity exports and prices, and increased EM-to-EM trade amid shifting trade linkages (an unintended consequence of sanctions, among other factors), along with the return of investment as the main growth driver after lagging in the previous decade (see chart 8). Remittance flows, once viewed as cyclical, have become a more structural factor – and we believe they will support growth as rising labor-to-capital ratios in developed markets continue to favor the export of labor from EMs with cheaper or more abundant labor pools.
Chart 8: After a Sharp Drop in Investment Ratios, We Project a Recovery Ahead
Source: IMF, PineBridge calculations as of January 2024
Cyclical factors behind higher EM growth include the alleviation of multi-year droughts amid shifts in El Nino weather patterns, along with rebounds in tourism and growth resets off low bases in countries that were strangled by high gas prices in 2022-2023. Additionally, rate hikes were enacted much earlier in emerging versus developed markets, and rate cuts have already started coming through – which, along with positive real wage growth, will support demand. Lastly, a few countries will soon emerge from debt restructuring processes, allowing them to start with a “clean slate.”
Debt Will Likely Move Sideways in 2024
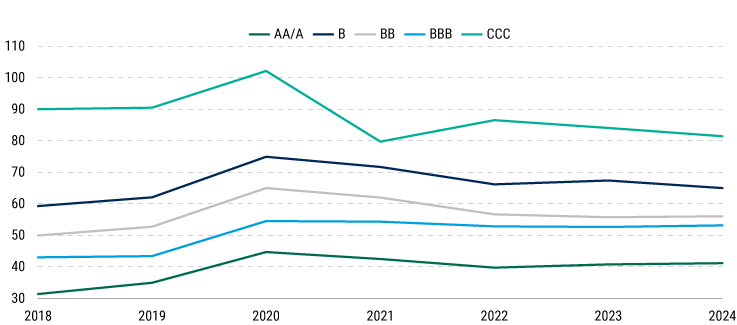
A major change for EMs has been the rapid deceleration in nominal GDP growth from the lofty highs reached in 2021 and 2022, which had driven debt-to-GDP ratios lower. Yet despite the higher debt/GDP ratios typically associated with lower nominal GDP growth, we expect debt ratios to move sideways in 2024, as they did in 2023. Furthermore, the broader trend masks variations among the underlying countries, 40% of which we expect to post lower debt/GDP ratios in 2024.
EM primary budgets are close to being balanced in aggregate, and with higher debt service costs, the scope for stimulus is limited. We therefore expect limited changes in fiscal finances and hence a more muted impact on spreads. There is some variation among the different rating buckets, however, with weaker-rated credits in particular likely to see their debt-to-GDP ratios drop, thereby boosting their creditworthiness.
Chart 9: Weaker-Rated Buckets Expected to Report Lower Debt/GDP Ratios
Source: IMF, Macrobond, PineBridge calculations as of January 2024.
Institutional Reform Continues
EM reform momentum remains strong, with improvement in governance indices and progress toward sound macro policies and economic diversification. International Monetary Fund (IMF) involvement in EM is the highest it has ever been, boosting the market’s confidence in the reform efforts’ credibility and longevity.
We believe progress will continue in 2024, with the largest election year EM has ever witnessed, putting reforms in the spotlight. These events will create market volatility, and our base case is that of the 25 pending EM elections, 14 will be market-moving events (i.e. having the ability to drive spread returns), with 10 delivering positive market outcomes.
Increased multi- and bilateral involvement in EM financing also alleviates concerns about the asset class’s upcoming maturity wall, which grows more significant starting in 2025. For 2024, we do not expect any credit to renege on its repayment commitments – in stark contrast to the record-high seven in 2022. And for 2025 onward, our calculations show that almost all credits that don’t benefit from market access will be able to plug the hole through either regional donor monies or multilateral/bilateral funding.
Valuations Are Tight for Hard Currency Assets, While Local Currency Debt is Undervalued
Because the EM sovereign hard currency spreads are already trading tight versus both historical levels and rating bucket averages, we believe improving creditworthiness is what will assist returns over the medium term. Total returns in 2024 are still historically attractive, however, assisted by the current high carry and returns driven by US treasury yields.
We also remain constructive on local currency assets. Already undervalued, EM foreign exchange levels will be supported by rising foreign direct investment, current account surpluses, and widening growth differentials. While the real policy rate gaps with developed markets are set to narrow, the rate-cutting and disinflation cycles in EM will be steeper (with more disinflation accompanied by more rate cuts), pushing yields lower. We still see a big valuation disconnect between slower EM nominal GDP growth and local yields – and we believe this dynamic can be unlocked when flows return to the asset class.
EM Sovereigns Look Set for a Stronger Year
After being plagued by external and cyclical headwinds over the past two years, we believe emerging markets can look forward to a more promising 2024, with both cyclical tailwinds and structural trends favoring EM assets. Structural shifts such as near-shoring will remain constructive well beyond 2024; indeed, we calculate that the wide positive buffer in EM-DM growth differentials will hold for at least the next two to three years. However, cyclical and external trends are particularly positive in the first half of this year. Despite tight valuations on hard currency assets, strong regional and credit rating upgrade stories will keep driving decoupling with DM assets, and local currency returns have strong support from both strong valuations and fundamentals.
For more investing insights, access our 2024 Global Investment Outlook.
Disclosure
Investing involves risk, including possible loss of principal. The information presented herein is for illustrative purposes only and should not be considered reflective of any particular security, strategy, or investment product. It represents a general assessment of the markets at a specific time and is not a guarantee of future performance results or market movement. This material does not constitute investment, financial, legal, tax, or other advice; investment research or a product of any research department; an offer to sell, or the solicitation of an offer to purchase any security or interest in a fund; or a recommendation for any investment product or strategy. PineBridge Investments is not soliciting or recommending any action based on information in this document. Any opinions, projections, or forward-looking statements expressed herein are solely those of the author, may differ from the views or opinions expressed by other areas of PineBridge Investments, and are only for general informational purposes as of the date indicated. Views may be based on third-party data that has not been independently verified. PineBridge Investments does not approve of or endorse any republication of this material. You are solely responsible for deciding whether any investment product or strategy is appropriate for you based upon your investment goals, financial situation and tolerance for risk.


