Emerging Market Corporate Bonds: The New Core Fixed Income Staple

Jonathan Davis
Client Portfolio Manager and Sustainable Investment Strategist – Emerging Markets Fixed Income

Over the past few years, we have often made the case that emerging market corporate bonds should be included as a core, rather than tactical, fixed income allocation. During that time, the central tenets of that assertion have been reinforced by performance across a fairly volatile cycle – featuring a global pandemic that prompted a global shutdown, followed by massive levels of monetary and fiscal policy support, which then gave way to monetary policy tightening. We also find salient factors supporting the asset class that may address current concerns about the market and economic outlook.
Among investment grade credit markets, the higher yield and lower volatility of EM corporates continue to make a case for the asset class, which now exceeds $2.5 trillion of investable assets1. Healthier balance sheets and a diversification of regional exposure away from economies facing heightened recession risk and toward countries with prospects for accelerating growth make for an equally compelling argument given the macroeconomic risks investors must navigate in the coming quarters.
The first point of comparison between investment grade (IG) hard-currency EM debt and US core fixed income is naturally yield. Over the past decade, investment grade EM corporate debt has delivered, on average, approximately 0.50-percentage-point higher yield than investment grade US corporate debt (see chart). As of midyear 2023, while investment grade sovereign EM debt valuations have compressed through US corporates, the relationship between EM and US IG corporates is right at historical averages.
Emerging Market Corporates Have Outyielded US Credit
Yield-to-worst: IG credit markets

Source: J.P. Morgan, Bloomberg Barclays and PineBridge Investments as of 30 June 2023. EM corporates: J.P. Morgan CEMBI Broad Div. IG; EM sovereigns: J.P. Morgan EMBI Global Div. IG; US credit: Bloomberg Barclays US Credit.
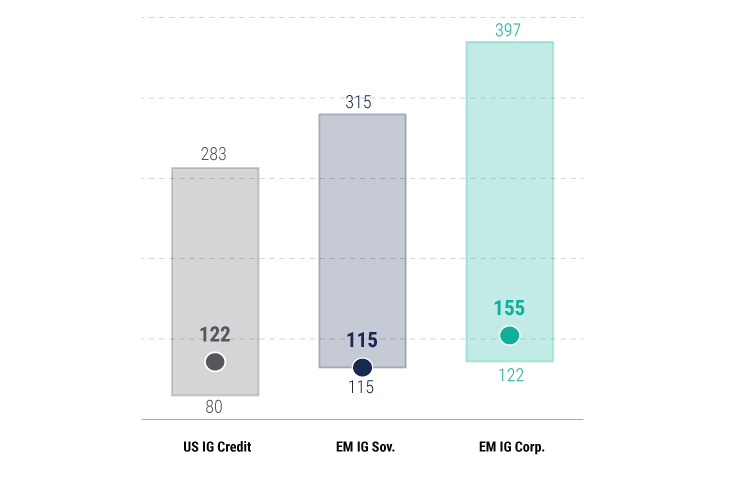
The positive returns for investment grade EM credit in the face of a substantial increase in nominal US Treasury yields speaks to the resilience of the asset class and investor demand – from June 2022 through June 2023, investment grade EM corporates returned 2.5%, investment grade EM sovereigns returned 3.4%, and investment grade US corporates returned 1.6%.2 That outperformance is also evident in the comparison of credit spreads across those markets and their respective historical ranges.
EM IG Corporate Spreads Have Outperformed
Trailing 10-year range and current spreads (bps)

Source: J.P. Morgan, Bloomberg Barclays, and PineBridge Investments as of 30 June 2023. EM Corporates: J.P. Morgan CEMBI Broad Div. IG; EM sovereigns: J.P. Morgan EMBI Global Div. IG: US Credit: Bloomberg Barclays US Credit.
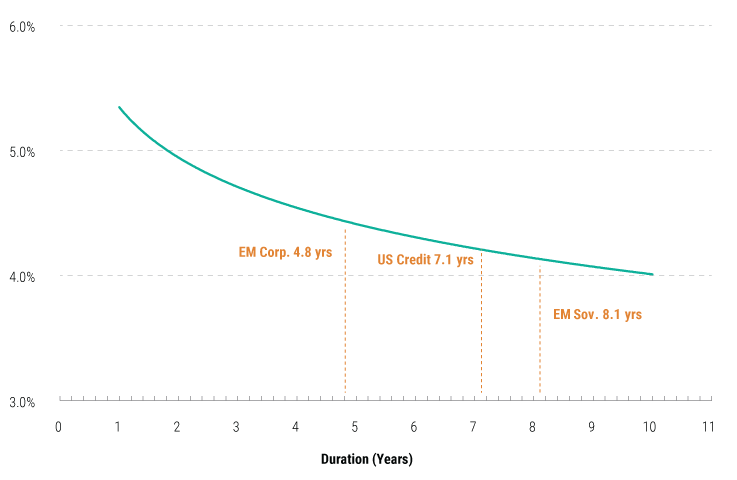
While all three markets are trading near the tighter end of their historical spread levels – investment grade EM sovereign spreads are currently at their 10-year lows – we must also consider where each of these markets lie on the US Treasury yield curve.
EM Corporates Have Significantly Lower Duration
US Treasury yield curve and index duration

Source: J.P. Morgan, Bloomberg Barclays, and PineBridge Investments as of 30 June 2023. EM corporates: J.P. Morgan CEMBI Broad Div. IG; EM sovereigns: J.P. Morgan EMBI Global Div. IG; US credit: Bloomberg Barclays US Credit.
Duration for the investment grade EM corporate bond market, on average, is 2.3 years shorter than for investment grade US corporate bonds and 3.3 years shorter than for investment grade EM sovereign bonds. As such, in an environment in which weaker risk sentiment causes the yield curve to flatten and credit spreads to widen, EM corporates stand a better chance of maintaining yield and positive returns, as there is more room for spread widening to be offset by compression of front-end nominal yields.
Many investors presume that the higher yield offered by EM corporate debt is compensation for a more volatile asset class than similarly rated US corporates. However, over the past decade, investment grade EM corporate bonds have delivered higher returns with less volatility than investment grade US corporate bonds. Compared with investment grade EM sovereign bonds – which have traditionally been the component of EM fixed income against which most external investors benchmark their exposure – EM corporates have materially outperformed in risk adjusted terms.
EM Corporates Have Delivered Higher Returns With Less Volatility Than US IG Corporates
Trailing 10-year annualized risk-adjusted returns

Source: J.P. Morgan, Bloomberg, and PineBridge Investments as of 30 June 2023. EM corporates: J.P. Morgan CEMBI Broad Div. IG; EM sovereigns: J.P. Morgan EMBI Global Div. IG; US credit: Bloomberg Barclays US Credit.
The EM corporate bond market has grown to roughly $2.5 trillion, approximately two-thirds of which is investment grade. By comparison, the investment grade US corporate bond market totals $6.3 trillion, and the global investment grade corporate bond market – as represented by the Bloomberg Global Corporate Index – totals $11.3 trillion. The EM investment grade corporate bond market is roughly 25% the size of the US and 15% of the global investment grade corporate bond markets, though EM corporate issuers represent just 2% and 5% of the US and global corporate bond indices.3
The geographic and economic concentration within both the US and global corporate bond markets take on an even greater risk considering the economic outlooks for emerging and developed economies. While developed markets are facing a likely slowdown of growth and potential recession, EM growth is expected to accelerate over the next six quarters. As such, we believe investors would benefit greatly from diversifying the regional exposure within their core credit allocations to include a dedicated allocation to investment grade EM corporate bonds.

Source: JP Morgan, Bloomberg, IMF, and PineBridge Investments as of 30 June 2023. EM Corp.: J.P. Morgan CEMBI Broad Div. IG; EM Sov.: J.P. Morgan EMBI Global Div. IG; US Credit: Bloomberg Barclays US Credit.
As market outlooks have focused on the impact of monetary policy tightening by the Fed, ECB, and many other central banks on credit markets, credit investors and rating agencies are likely to take a closer look at the balance sheets of corporate bond issuers. Emerging market corporates have maintained a consistent strategy to reduce leverage over the past decade, the result of which has been a decoupling of leverage ratios from those of similarly rated US corporates: Investment grade EM corporates have an average net leverage ratio of 0.9 times, compared with 2.6 times for investment grade US corporates and 2.7 times for investment grade European corporates. In fact, the 0.9 times net leverage for investment grade EM corporates is the lowest level in the recorded history of the asset class. The strength of EM corporate balance sheets should support credit ratings that might otherwise come under pressure from declining revenues in the event of a developed market-led slowdown in global growth.
EM IG Corporate Net Leverage is Much Lower Than in the US and Europe

Source: JP Morgan and PineBridge Investments as of 31 March 2023.
Investors are not unfamiliar with emerging markets overall, with many sourcing exposure via global mandates. However, emerging market corporate bonds are often still viewed as a tactical allocation for fixed income portfolios, rather than a core holding. The long-term attributes of the asset class – attractive yield, strong risk-adjusted returns, and the size of the market – have been the cornerstones of our favorable view for many years. Looking out toward the second half of 2023 and beyond, we see even more near-term cyclical factors, such as curve positioning, regional diversification, and strong credit metrics, that are likely to support the asset class – and we believe now is the time for investors to add exposure to EM corporates and position themselves to benefit from those dynamics.
For more investing insights, read our 2023 Midyear Fixed Income Outlook.
Disclosure
Investing involves risk, including possible loss of principal. The information presented herein is for illustrative purposes only and should not be considered reflective of any particular security, strategy, or investment product. It represents a general assessment of the markets at a specific time and is not a guarantee of future performance results or market movement. This material does not constitute investment, financial, legal, tax, or other advice; investment research or a product of any research department; an offer to sell, or the solicitation of an offer to purchase any security or interest in a fund; or a recommendation for any investment product or strategy. PineBridge Investments is not soliciting or recommending any action based on information in this document. Any opinions, projections, or forward-looking statements expressed herein are solely those of the author, may differ from the views or opinions expressed by other areas of PineBridge Investments, and are only for general informational purposes as of the date indicated. Views may be based on third-party data that has not been independently verified. PineBridge Investments does not approve of or endorse any republication of this material. You are solely responsible for deciding whether any investment product or strategy is appropriate for you based upon your investment goals, financial situation and tolerance for risk.


